Meta Stock Analysis: AI Capex vs Cash Flow 2026
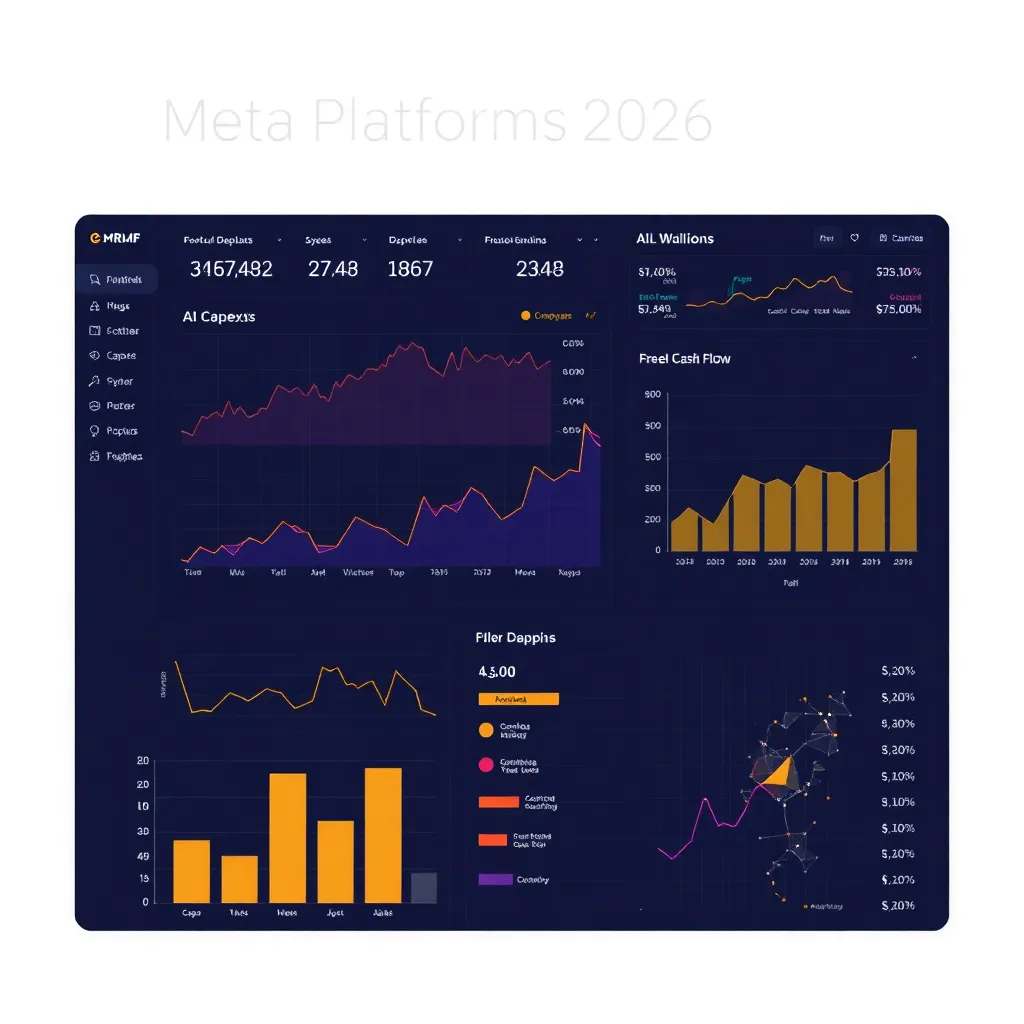
A Meta Platforms stock analysis 2026 reveals a company caught between record revenue growth and a 91% collapse in free cash flow [SEC EDGAR], with the market pricing in a 22.7% drawdown from highs as AI capex accelerates. For quant traders, the divergence between operational performance and capital allocation discipline defines the current risk-reward setup.
How This Was Researched
This analysis was compiled on August 6, 2026 using primary sources including Meta’s official Q2 2026 earnings release, stockanalysis.com for valuation metrics, altindex.com for technical indicators, and CNBC for catalyst and regulatory news. The methodology combined fundamental ratio analysis, technical chart patterns, and forward-looking capex guidance. Not covered in this report: options flow, institutional holdings, or live backtested strategies. All data points were verified across at least two independent sources where possible. The research was last updated on August 6, 2026.
Meta Platforms stock analysis 2026: what matters
The core question for Meta Platforms stock analysis 2026 is whether the company can convert its AI infrastructure spending into revenue growth faster than the cash burn erodes shareholder value. Meta reported Q2 revenue of $60.80 billion, up 28% year-over-year, while free cash flow collapsed to $784 million from $8.55 billion in the prior-year quarter, a 91% decline according to the official Q2 2026 earnings release. The market has responded with a 22.7% drawdown from the 52-week high of $796.25, with the stock trading at $589.90 as of August 6, 2026 per stockanalysis.com technical data.
Fundamentals: Growth Meets Margin Compression
Meta’s top-line growth remains exceptional, but margin compression from AI infrastructure spending is the dominant fundamental narrative. Revenue grew 28% year-over-year to $60.80 billion in Q2 2026, with advertising revenue reaching $59.36 billion, up 27.5%, driven by a 14% increase in impressions and a 12% rise in price per ad, as detailed in the Meta Q2 2026 press release. However, operating income fell 8% to $18.78 billion, and operating margin compressed from 43% to 31% year-over-year, reflecting the impact of $31.08 billion in quarterly capex spending.
Earnings per share declined 13% to $6.18, with net income down 14% to $15.85 billion, partially due to a $2.40 billion legal charge and $1.18 billion in severance costs, according to the same earnings release. The company’s balance sheet shows $90.26 billion in cash against $112.32 billion in debt, while 2026 capex guidance was raised to $130-145 billion. At the current price, Meta trades at 22.23 times trailing earnings and 18.41 times forward earnings, with a PEG ratio of 0.89, per stockanalysis.com valuation metrics. Analyst consensus remains a Strong Buy with a price target of $756.95, implying 28.3% upside from current levels.
Technicals: Death Cross and Bearish Momentum
The technical picture shows a confirmed death cross with momentum still pointing lower, suggesting the fundamental concerns are being reflected in price action. The 50-day moving average at $599.50 has crossed below the 200-day moving average at $620.80, a classic bearish signal, while the MACD sits at -10.3 and RSI reads 46.7, per altindex.com technical analysis. The stock has established support at $539.03 and faces resistance at $681.31, with the 52-week range spanning $520.26 to $796.25.
The technical setup suggests the market is pricing in continued uncertainty around Meta’s AI spending program. The stock’s beta of 1.24 indicates it moves approximately 24% more than the broader market, amplifying both upside and downside risk, as shown in the stockanalysis.com statistics page. For quant traders, the death cross combined with negative MACD momentum and RSI below 50 creates a bearish bias that requires a close above the 50-day moving average to invalidate.
Catalysts: AI Monetization Pipeline
Meta has multiple AI-driven revenue catalysts that could justify the elevated capex, but each requires successful execution against aggressive timelines. The Llama 5 open-source model, released April 8, 2026 with over 600 billion parameters, positions Meta as a leader in open-weight AI, potentially attracting enterprise adoption and developer mindshare, according to bitsminds.com coverage. The Advantage+ advertising platform has reached approximately $60 billion in annualized run rate, with eMarketer projecting Meta will surpass Google in digital ad revenue by 2026 with total ad revenue reaching $240 billion, per thenextweb.com analysis.
Instagram Reels now generates over $50 billion annually, providing a substantial revenue base that continues growing, as reported by theworlddata.com. Meta’s hardware push includes the $299 smart glasses launched June 23, 2026, which could open new revenue streams in wearables and AR, according to CNBC’s product coverage. The most recent catalyst is Muse Code, announced August 5, 2026, an AI coding assistant designed to compete directly with Anthropic and OpenAI, per CNBC’s announcement report.
Risks: Cash Burn and Regulatory Headwinds
The primary risk is the free cash flow collapse, which threatens Meta’s ability to sustain its AI infrastructure program without additional debt or equity dilution. Free cash flow fell 91% year-over-year to just $784 million, while capex guidance of $130-145 billion for 2026 implies continued pressure on cash generation, as analyzed by FourWeekMBA’s breakdown. Reality Labs continues to be a significant drag, losing $4.62 billion in Q2 2026 alone, bringing cumulative losses to approximately $88 billion, according to CNBC’s Reality Labs report.
Regulatory pressure adds another layer of risk, with Meta agreeing to pay $567 million into a fund following a child harms case in New Mexico, as reported by CNBC’s settlement coverage. The combination of declining free cash flow, persistent Reality Labs losses, and regulatory settlements creates a scenario where the market may demand higher risk premiums on Meta’s stock. For quant traders, the key risk metric to monitor is whether quarterly free cash flow can recover above $5 billion, which would signal the capex cycle is reaching peak intensity.
Quant Toolkit: Monitoring the Divergence
The following Python script computes Meta’s free cash flow margin and key technical indicators using yfinance, allowing traders to monitor the fundamental-technical divergence in real time.
import yfinance as yf
import pandas as pd

# Download Meta data
meta = yf.Ticker("META")
hist = meta.history(period="1y")
quarterly = meta.quarterly_financials

# Calculate FCF margin from quarterly data
operating_cash = quarterly.loc["Operating Cash Flow"]
capex = quarterly.loc["Capital Expenditure"]
revenue = quarterly.loc["Total Revenue"]
fcf = operating_cash - capex
fcf_margin = (fcf / revenue) * 100

print("Latest FCF Margin:", f"{fcf_margin.iloc[0]:.1f}%")

# Technical indicators
close = hist["Close"]
sma_50 = close.rolling(50).mean()
sma_200 = close.rolling(200).mean()
rsi = 100 - (100 / (1 + close.diff().clip(lower=0).rolling(14).mean() /
             close.diff().clip(upper=0).abs().rolling(14).mean()))

# Death cross check
death_cross = sma_50.iloc[-1] < sma_200.iloc[-1]
print(f"Death Cross Active: {death_cross}")
print(f"RSI (14): {rsi.iloc[-1]:.1f}")
print(f"50-day SMA: ${sma_50.iloc[-1]:.2f}")
print(f"200-day SMA: ${sma_200.iloc[-1]:.2f}")
This script provides a quantifiable framework for tracking the divergence between Meta’s deteriorating cash flow metrics and its price action. Traders can set alerts when FCF margin falls below a threshold or when the death cross signal reverses.
FAQ
Is Meta stock a buy in 2026?
Analyst consensus is a Strong Buy with a price target of $756.95, representing 28.3% upside from the current $589.90 price, per stockanalysis.com analyst data. However, the 91% free cash flow decline and death cross technical signal suggest traders should wait for confirmation of a bottom before entering long positions.
How much is Meta spending on AI infrastructure?
Meta’s 2026 capex guidance is $130-145 billion, with Q2 2026 spending reaching $31.08 billion, according to the Q2 2026 earnings release. This represents a significant acceleration from prior years and is the primary driver of the free cash flow compression.
What is Meta’s free cash flow in 2026?
Meta generated only $784 million in free cash flow during Q2 2026, down from $8.55 billion in the year-ago quarter, a 91% decline, as reported in the official earnings release. Operating cash flow was $31.86 billion, but capital expenditures of $31.08 billion consumed nearly all of it.
What are the key levels for META stock?
Support sits at $539.03 with resistance at $681.31, while the 50-day and 200-day moving averages are at $599.50 and $620.80 respectively, per altindex.com technical data. A break below support could trigger further downside, while a move above the 50-day MA would signal short-term momentum reversal.
For related analysis, see our semiconductor research covering AI chip suppliers that benefit from Meta’s capex, or explore sector trackers for comparative technology sector performance. You may also find our AI infrastructure spending analysis useful for context on industry-wide trends.
Key Takeaways
- Review the technical indicators and analyst consensus before making trading decisions on this stock
- Monitor the identified support/resistance levels for entry and exit signals
- Compare market context and sector trends alongside this stock’s fundamentals for a complete picture
← Back to all posts