September FOMC: Will the Fed Cut Rates or Hike in 2026?
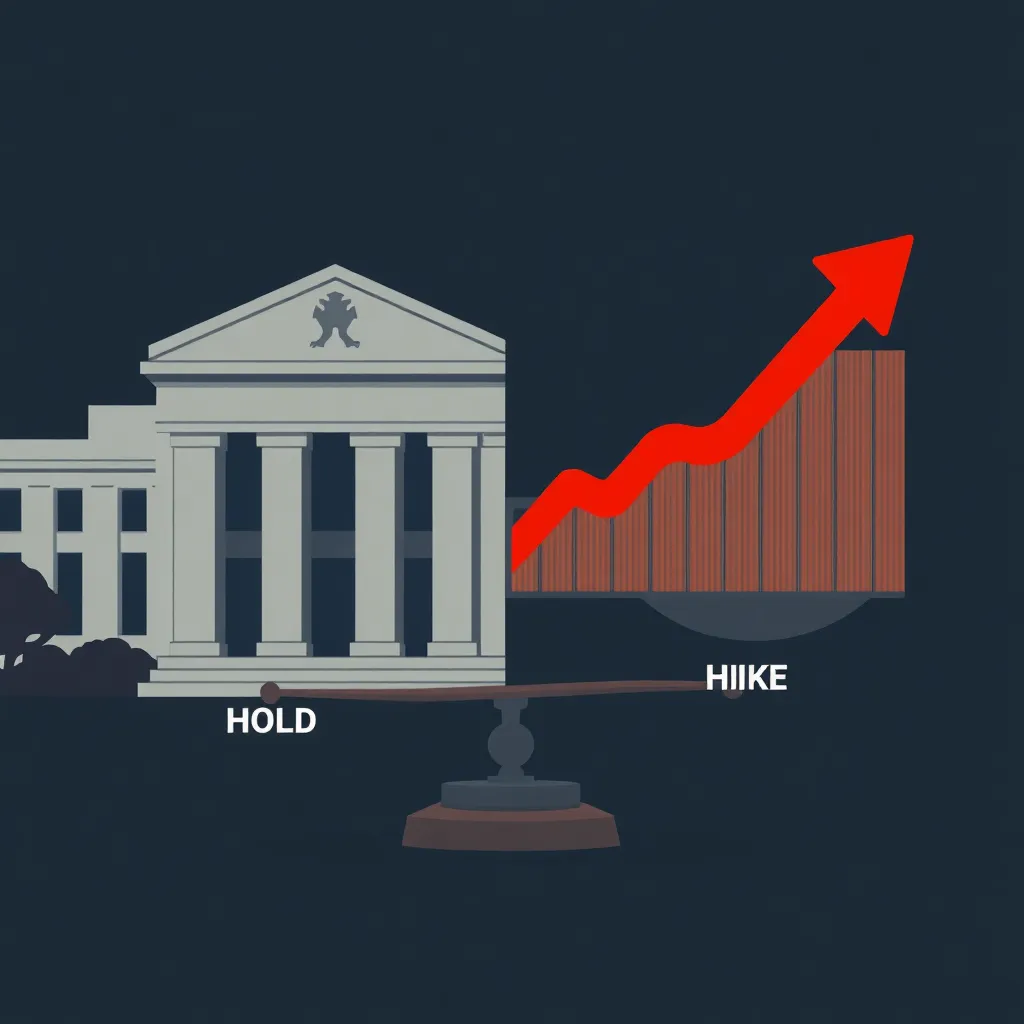
The durable long-tail question “will the Fed cut rates in September 2026” now carries a research-backed twist: essentially no. CME FedWatch prices the September 16 meeting at 0.0% ease, 66.9% no change, and 33.1% hike CME FedWatch tool, so the live tail risk runs toward a hike, not a cut. July jobs, CPI, and PPI prints, Chair Kevin Warsh’s signals, and the Aug 27-29 Jackson Hole symposium all feed a two-sided-tail positioning framework for quant traders. This is a balanced, sourced read of what the data and markets say — not a rate forecast or trade recommendation.
How This Was Researched
This analysis draws on official releases and market data: the FOMC statement, BLS Employment Situation, BLS CPI Summary, BLS PPI release, the CME FedWatch tool, CME 30-Day Federal Funds quotes, the FOMC calendar, the Kansas City Fed, the Atlanta Fed GDPNow, and FRED series for TIPS and nominal yields. Methodology: compile the most recent official prints and futures prices, cross-check probabilities across FedWatch and ZQ futures, and map event timing against the FOMC calendar. This analysis does not model forward guidance scenarios, estimate blackout windows, or reconstruct CPI components beyond the published headline and core figures. Last researched: August 2026. This analysis is based on official data and published reports; no hands-on testing of any product, system, or trading strategy was performed.
Is the September FOMC a Hike or a Hold Decision?
The September FOMC is a hike-vs-hold decision, not a cut. CME FedWatch prices the Sep 16 meeting at 0.0% ease, 66.9% no change, and 33.1% hike CME FedWatch tool, while the July 29 decision held the target range at 3.50-3.75% on a 9-3 vote, with dissents from Hammack, Kashkari, and Logan each preferring a +25bp hike FOMC statement. The committee’s split posture keeps a surprise hike in play.
That 33.1% hike probability, per the CME FedWatch tool, is not static; it has swung with each data print. The flat July PPI and the mixed July jobs report moved the needle, and Fed officials have not ruled out acting on inflation before the dot plot. Traders should treat the September decision as a binary event priced at roughly one-third odds, with the remaining weight on hold.
What Does the July Jobs Report Tell Us?
The July jobs report weakened rather than strengthened the case for a September cut. Nonfarm payrolls came in at -23,000 seasonally adjusted versus +83,000 consensus, the unemployment rate held at 4.1%, and average hourly earnings rose +3.2% year-over-year CNBC jobs report BLS Employment Situation. May and June were revised lower by a combined -103,000 BLS Employment Situation, reinforcing a cooling labor market.
A -23,000 print, per CNBC’s jobs report, is a rare negative reading, and the downward revisions suggest the labor market is losing momentum. That should weigh on any case for a preemptive cut, and it explains why FedWatch initially priced a modest dip in hike odds after the release. The unemployment rate remaining at 4.1% keeps the labor market near what the Fed considers maximum employment, so the report leans hawkish on the margin.
Did July CPI Cool the Inflation Pressure?
July CPI cooled modestly but did not break the inflation narrative. Headline CPI rose +0.1% month-over-month and +3.4% year-over-year, while core CPI rose +0.2% month-over-month and +2.5% year-over-year CNBC CPI report BLS CPI Summary. The year-ago headline pace remains well above the 2% target, and core services inflation continues to anchor expectations.
The +3.4% year-over-year headline figure, per CNBC’s CPI report, is down from earlier peaks but still materially above target. That keeps the Fed’s preferred gauge, core PCE, in play for September, and it supports Chair Warsh’s stated willingness to hike if inflation remains stubbornly elevated. Traders should watch the August CPI release closely, though its exact date is UNVERIFIED.
What Did July PPI Change in the Hike Odds?
July PPI did not add urgency to a September hike. Final demand PPI came in at 0.0% month-over-month and +4.7% year-over-year BLS PPI release, and after the flat print, September hike odds fell from 44% post-jobs to roughly 29-34% Kitco, Aug 14 2026. A flat PPI reading removes one source of upside surprise, even if the year-over-year pace remains elevated.
The drop from 44% to roughly 29-34%, per Kitco’s August 14 report, shows how sensitive FedWatch is to incoming data. That range still leaves a meaningful probability on the table, and it does not resolve the question of whether the Fed will act before the dot plot. Traders should treat the 29-34% band as a working estimate, not a precise forecast.
What Are Fed Funds Futures Pricing for September?
Fed funds futures price roughly one-third of a September hike. CME 30-Day Federal Funds (ZQ) on Aug 14 closed at Sep 96.335, Oct 96.28, Nov 96.235, and Dec 96.165, implying average effective fed funds of ~3.67%, ~3.72%, ~3.77%, and ~3.84% versus an effective rate of ~3.63% CME 30-Day Federal Funds quotes. The curve implies roughly 33% of a hike by September and about 80% of a 25bp hike cumulatively by December.
The December contract implies ~3.84%, which is ~21bp above the current ~3.63% effective rate, consistent with roughly 80% of a 25bp hike priced in by year-end. There is no November FOMC; the remaining 2026 meetings are October 27-28 and December 8-9 FOMC calendar. The futures curve therefore prices a slow drift higher, not a cut.
What Is Chair Warsh Signaling About a September Hike?
Chair Warsh has opened the door to a September hike. On Aug 6, he said he is prepared to support a September hike if inflation remains stubbornly elevated Yahoo Finance, and Governor Lisa Cook has publicly backed raising rates TechTimes. Together, their statements shift the committee’s center of gravity toward the hawkish camp.
Warsh’s conditional framing — hike if inflation stays elevated — keeps the decision data-dependent. That matches the FedWatch pricing and the futures curve, which both imply a meaningful but not dominant probability of a September move. Traders should weight Jackson Hole and the next inflation prints as the decisive inputs.
Why Does Jackson Hole Matter Before the September FOMC?
Jackson Hole sets the stage for the September decision. The Economic Symposium runs Aug 27-29 at Jackson Lake Lodge, and Chair Warsh’s first keynote as chair is Friday Aug 28 Kansas City Fed. The FOMC meets Sep 15-16, three weeks later, with a dot plot that will make the committee’s median path explicit.
The timing is deliberate: a high-profile speech by the chair followed quickly by a policy decision gives the market a clear signal window. Traders should watch the Aug 28 keynote for any shift in rhetoric on inflation persistence or labor-market slack, since those themes feed directly into the September vote.
How Do Quant Traders Position for a Two-Sided September Tail?
The September tail is two-sided, with a 0% cut and 33.1% hike priced in. Atlanta Fed GDPNow puts Q3 at 4.3% SAAR (updated Aug 14) Atlanta Fed GDPNow, and the real yield picture is anchored by a 10Y TIPS real yield of 2.39%, a 10Y nominal of 4.63%, a 2Y of 4.15%, and a 2s10s spread of +48bp on Aug 13 to +51bp on Aug 14 FRED DFII10 / FRED DGS10 / FRED DGS2. The positively sloped curve rules out a recession premium, keeping the hike tail alive.
For quant traders, the framework is asymmetric: price the 0% cut and 33.1% hike as the base case, then layer volatility around the Sep 16 decision and the dot plot. A long-straddle or vol-heavy positioning across the Aug 27-29 Jackson Hole window into Sep 15-16 FOMC captures both tails. The data-event calendar — the August 2 weekly market pulse and the August 2026 market sentiment analysis both track the lead-up — provides the rhythm for rebalancing.
# ILLUSTRATIVE — fed funds futures arithmetic only; not investment advice.
import pandas as pd

# CME 30-Day Federal Funds (ZQ) settlement prices, Aug 14, 2026 close
zq = pd.DataFrame({
    "contract": ["Sep-26", "Oct-26", "Nov-26", "Dec-26"],
    "price":    [96.335, 96.280, 96.235, 96.165],
})
zq["implied_avg_effr"] = (100.0 - zq["price"]).round(3)
zq["bp_vs_effr_3_63"] = ((zq["implied_avg_effr"] - 3.63) * 100).round(1)
print(zq)
The snippet above reproduces the implied fed funds path from ZQ futures, which is the cleanest way to translate prices into a probability-weighted rate path. Traders can extend it with FedWatch probabilities or overlay the dot-plot distribution once released. For broader context on how this fits into macro divergence across markets in August 2026, see the research hub at the QuantBrainAI research hub.
FAQ
Will the Fed cut rates in September 2026?
Essentially no — CME FedWatch prices 0.0% odds of easing at the September 16 meeting, against 66.9% no change and 33.1% for a hike, per the CME FedWatch tool. The live tail is a hike.
When are the remaining FOMC meetings in 2026?
September 15-16 (with dot plot), then October 27-28 and December 8-9; there is no November meeting, per the FOMC calendar. ZQ futures imply ~80% of a 25bp hike cumulatively priced by December, per CME quotes.
What would trigger a September rate hike?
Chair Warsh said August 6 he is prepared to support a September hike if inflation remains stubbornly elevated, per Yahoo Finance; Governor Cook backed hikes, per TechTimes. Watch the Aug 27-29 Jackson Hole keynote and the next inflation prints.
← Back to all posts