AI Capex vs GDP: Analyzing the Macro Divergence
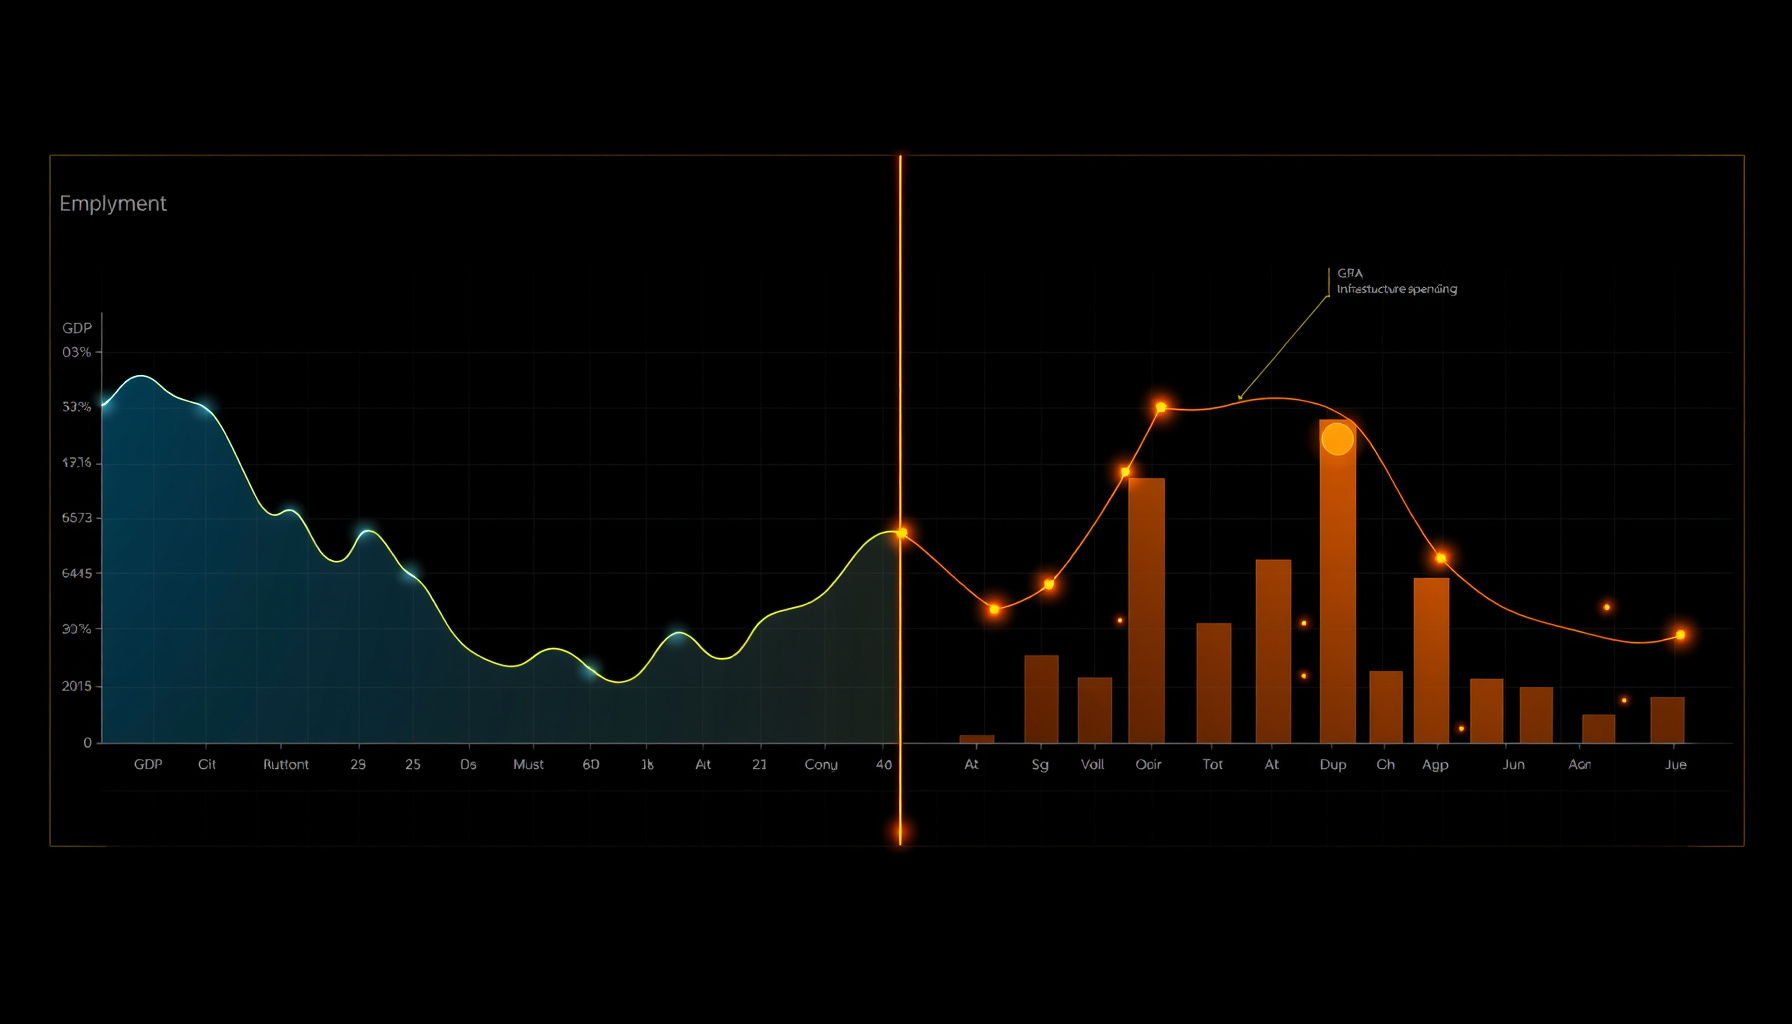
The U.S. economy is sending two conflicting signals. The macro data — GDP, jobs, and consumer spending — points to a deceleration that has markets pricing in rate cuts. Yet the five largest U.S. technology firms are committing over $660 billion to AI infrastructure in 2026, nearly double last year’s spend, per the Futurum Group. This AI capex vs GDP slowdown divergence is the defining macro pattern of the year, and it is creating a fertile environment for quant strategies that can systematically separate signal from noise.
How This Was Researched
This analysis synthesizes data from the BEA’s advance GDP estimate (July 30, 2026), the BLS CPI report (July 14, 2026), the June Nonfarm Payrolls release, the FOMC’s July 29 statement, and hyperscaler capex guidance from public earnings calls and investor relations. Macro data points were collected during the week of July 28–August 1, 2026, and cross-referenced with current market pricing for rate expectations via Trading Economics. We do not cover individual stock recommendations, technical analysis, or short-term trading signals. Last researched: August 2026.
What happened with Q2 GDP growth?
Real GDP grew at a 1.5% annualized rate in Q2 2026, down from 2.1% in Q1 and missing the 2.1% consensus forecast, according to the BEA advance estimate. Nonresidential fixed investment slowed to 8.4% from 10.6%, and inventories subtracted 0.7 percentage points. Real final sales, which strip out inventory volatility, rose 2.2%, suggesting underlying demand is holding up better than the headline number implies, per EY’s macroeconomic analysis.
The deceleration is broad-based but not catastrophic. The drop from 2.1% to 1.5% is meaningful, but the strength in final sales indicates consumer and business spending are not collapsing. The inventory drag is a technical factor that often reverses in subsequent quarters. The key takeaway for quants: this is a slowdown, not a recession, and the composition of GDP matters more than the headline rate for sector rotation. This extends the pattern identified in our earlier macro economic outlook.
Is the labor market signaling a recession?
The June 2026 Nonfarm Payrolls report showed only +57,000 jobs added versus 110,000 expected — roughly half of what Wall Street predicted, as reported by TradingKey’s preview. The unemployment rate held at 4.2%, and continued claims rose to 1.82 million. This is a clear cooling trend, but the stable unemployment rate suggests we are not yet in recessionary territory, consistent with unemployment data trends.
The labor market is the Fed’s primary mandate, and this weakness is the main driver behind the market’s growing expectation of a September rate cut. For quant models, the divergence between the headline NFP number and the stable unemployment rate is a classic sign of a labor market that is slowing but not breaking. This is the kind of nuanced signal that regime detection models should be capturing — a theme we explored in our macro crosscurrents analysis.
What is the Fed doing about the slowdown?
The FOMC held the federal funds rate at 3.50%-3.75% on July 29, 2026, marking the fifth consecutive hold after cutting from a peak of 5.25%-5.50% during 2024-2025, according to Trading Economics. The committee left the door open for a September cut, and Polymarket’s Fed decision tracker confirmed the hold was fully priced in. The full FOMC meeting calendar shows the September meeting is the next decision point.
The Fed is data-dependent, and the recent labor market weakness combined with disinflation is building the case for easing. However, headline CPI at 3.5% is still above the 2% target, and core CPI at 2.6% shows the last mile of disinflation remains sticky. The July meeting was a placeholder; the September meeting is where the action will be. For quants, this means volatility around FOMC dates will be elevated, and positioning for a cut is the consensus trade.
How does AI infrastructure spending diverge from the broader economy?
The five largest U.S. cloud and AI infrastructure providers — Microsoft, Alphabet, Amazon, Meta, and Oracle — have committed $660 billion to $725 billion in capex for 2026, nearly doubling 2025 levels, according to the Futurum Group’s capex analysis. Amazon leads at ~$200 billion, followed by Google at ~$185 billion, Meta at ~$125 billion, and Microsoft at ~$120 billion. Aggregate estimates for 2026-2031 reach $7.6 trillion, per ValueAdd VC’s spending tracker.
This is the core of the divergence. While the broad economy grows at 1.5%, these firms are growing their capital expenditures at nearly 100% year-over-year. This spending is a direct counter-cyclical force that is propping up the AI semiconductor sector and related supply chains, as detailed in our AI semiconductor sector spotlight. The spending is concentrated in a few tech giants with strong balance sheets and a strategic imperative to build, creating an island of extraordinary demand.
How should quant traders position for this divergence?
Quant traders should treat this as a two-regime market: a macro regime that is slowing and an AI capex regime that is accelerating. Our HMM regime detection methodology is well-suited for this — feed it the macro data points (GDP, NFP, CPI) and the capex data separately, and it will identify the latent states. The divergence itself is a third regime where these two signals are in conflict, requiring dynamic weight adjustments.
Positioning should be tactical. In the macro regime, favor rate-sensitive sectors like utilities and REITs. In the AI capex regime, favor semiconductors, networking equipment, and power infrastructure. The key is to weight signals by their reliability. The capex numbers are hard commitments from corporate balance sheets; the GDP numbers are noisy revisions. In a divergence, the more reliable signal should carry more weight in your factor models. For a broader framework, see our macro economy trends coverage.
What data series should you watch to monitor the divergence?
The divergence is not static — it widens and narrows as new data arrives, and watching the right releases tells you which regime is winning. On the macro side, the two most important series are the monthly Nonfarm Payrolls report and the CPI print, because they directly drive the Fed’s rate path. The June payrolls miss (+57,000 vs. 110,000 expected) and the core CPI reading at 2.6% are the data points that moved market expectations most this summer. On the capex side, watch quarterly earnings calls from Microsoft, Alphabet, Amazon, Meta, and Oracle for revisions to their full-year guidance — a cut to 2026 guidance would be the first real signal that the divergence is resolving, while an increase would confirm it is still widening, per the Futurum Group’s capex tracking.
A simple monitoring framework is to track the spread between rate-sensitive sectors (utilities, REITs) and AI-capex beneficiaries (semiconductors, power infrastructure) on a weekly basis. When the spread widens, the two-regime market is intact. When it compresses, the market is pricing convergence — either the economy accelerating into the capex cycle or the capex cycle being cut back to meet the economy. Our weekly market pulse recaps these series every Sunday.
FAQ
Will the Fed cut rates in September 2026?
The market is pricing in a high probability of a September cut, driven by the weak June jobs report (+57,000 vs. 110,000 expected) and continued disinflation. Core CPI at 2.6% is approaching the Fed’s target, per Trading Economics. However, the Fed has held five times and values optionality, so the cut is not guaranteed. The August CPI report and July jobs data will be the deciding factors. The FOMC calendar shows the September meeting is scheduled for mid-September.
Is the AI capex boom sustainable if GDP slows?
The $660 billion+ in committed 2026 capex is largely locked in, but the longer-term $7.6 trillion estimate is more speculative. If GDP slows further and enters a recession, these firms may face pressure to trim 2027 guidance. However, AI infrastructure spending is strategic and counter-cyclical; these firms are betting that AI revenue will outpace the macro cycle, as Futurum Group reports. The risk is a funding gap if capital markets tighten, but current balance sheets are strong enough to withstand a moderate slowdown.
How do you trade the macro divergence?
Trade it as a spread. Long the AI capex beneficiaries (semiconductors, power, networking) and short or underweight the rate-sensitive, economically cyclical sectors that are vulnerable to the GDP slowdown. Monitor breadth and the yield curve for signs that the divergence is resolving — either the economy catches up to the capex boom or the capex boom gets cut back. Systematic trend-following models applied to relevant ETF pairs (e.g., XLK vs. XLI) can signal when the divergence is strengthening or weakening. Always backtest within a disciplined risk framework.
← Back to all posts