Labor Market Shock: Quant Signals From the July Jobs Report
Labor market weakness and yield curve signals collided on August 7, 2026, when the Bureau of Labor Statistics reported that nonfarm payrolls declined by 23,000 — the first negative print in five months and a dramatic miss against the +80,000 consensus [BLS]. The unemployment rate ticked down to 4.1%, but only because 264,000 workers exited the labor force entirely, pushing participation to its lowest level since early 2021. For systematic strategies, this report forces a reweighting across duration, sector, and volatility dimensions.
How This Was Researched
This analysis draws on primary government data releases and official Federal Reserve communications. The core dataset is the BLS Employment Situation Summary for July 2026, published August 7, which provides payroll counts, unemployment rates, wage data, and revisions. We cross-referenced market reactions and consensus expectations against Reuters coverage of the report. Federal Reserve policy context comes from the official FOMC statement of July 29, 2026. Equity market data was verified via CNBC market coverage. We did not independently run backtests on the strategies discussed — conclusions are analytical frameworks, not verified returns. Last researched: August 2026.
The Headline Numbers: A Sharp Break
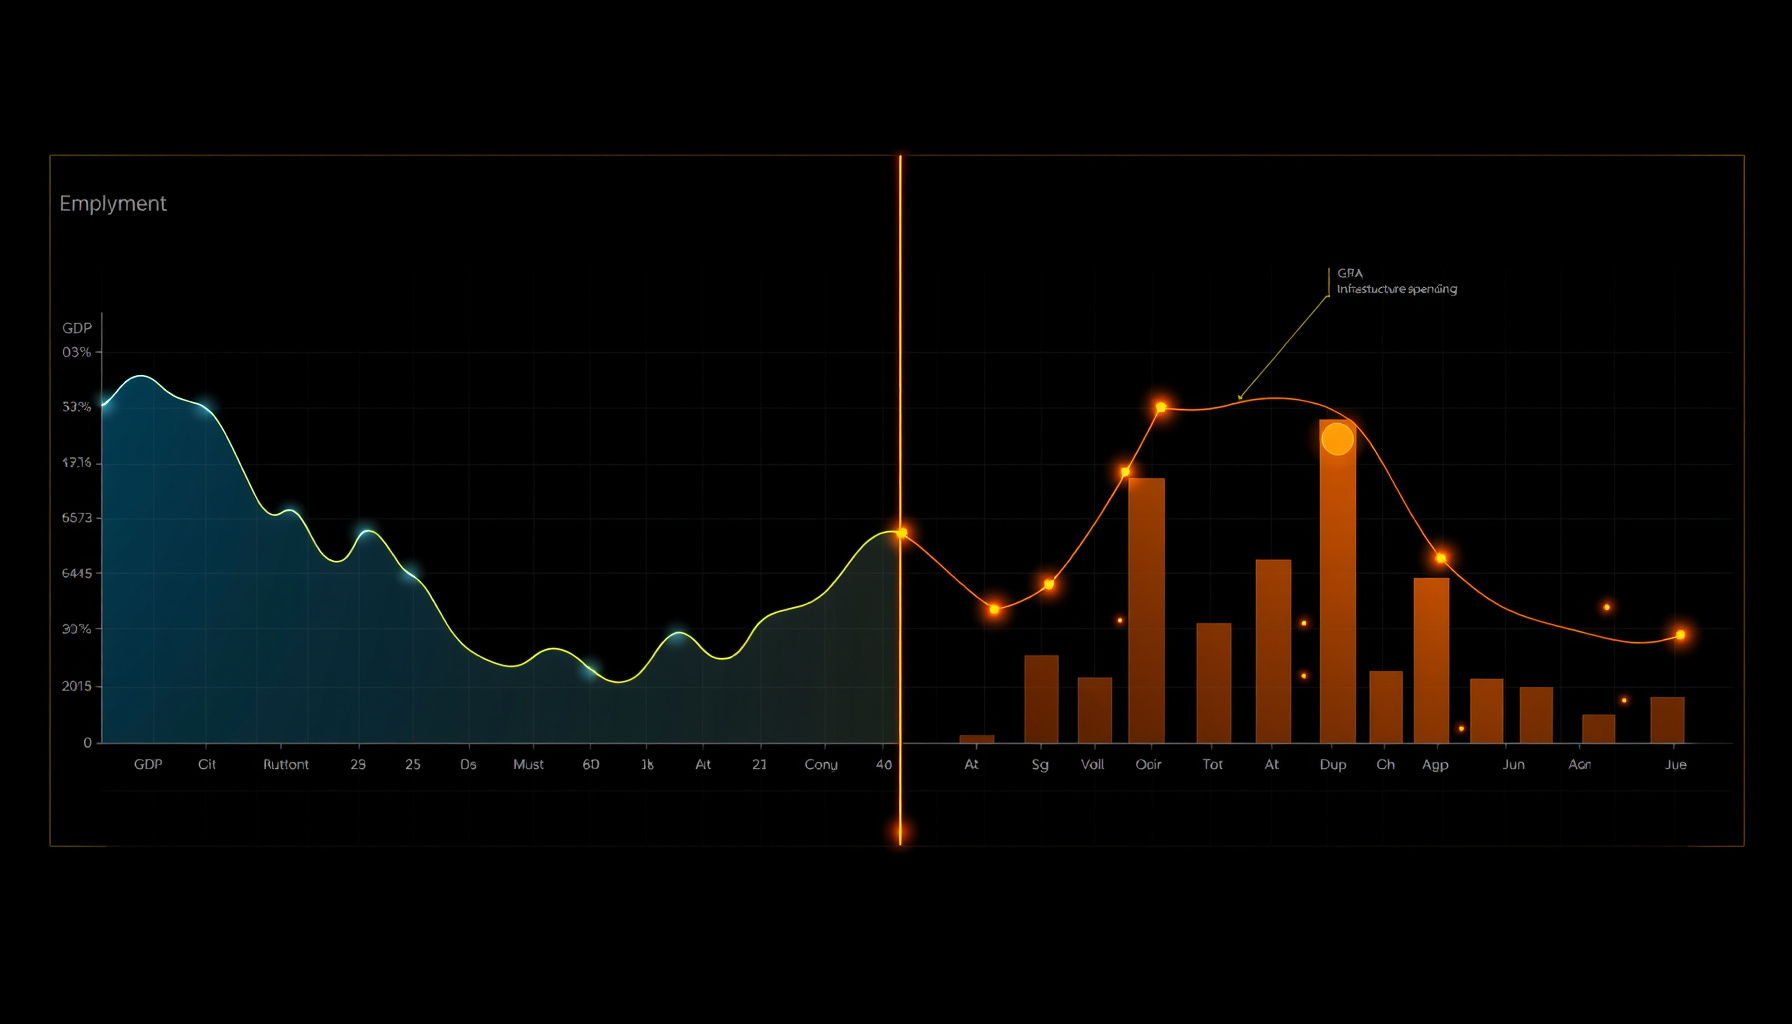
The July 2026 employment report showed nonfarm payrolls declining by 23,000 — the first negative print in five months and a significant miss against the +80,000 consensus tracked by Reuters. The BLS also revised May down by 66,000 and June down by 37,000, removing 103,000 previously reported jobs and cutting the three-month average to just 20,000 per month.
For quant models that consume payroll surprises as features, this is a regime-level signal. The May-June downward revisions alone exceed many monthly prints [BLS], meaning models that weighted earlier data are working with stale inputs. The Sahm Rule — which triggers when the three-month moving average of unemployment rises 0.5 percentage points above its 12-month low — remains untriggered at 4.1%, but the direction of travel is clearly negative. Factor models that overweight employment momentum should consider the revision risk embedded in the current data vintage.
The Participation Rate Collapse Is the Real Story
The unemployment rate fell to 4.1% from 4.2% in June, but the decline was driven entirely by 264,000 workers leaving the labor force — not by hiring. The participation rate dropped to 61.4%, the lowest since February 2021. According to Reuters, immigration enforcement policies have reduced the labor force by more than one million workers in 2026 alone, creating a structural supply shock distinct from cyclical weakness.
This distinction matters for quantitative models. A demand-driven employment decline suggests economic contraction and warrants defensive positioning. A supply-driven contraction — where workers disappear rather than are fired — implies tightening labor markets for remaining workers, persistent wage pressure, and potential inflation stickiness. The labor force has declined by 228,000 persons per month since January, and these individuals appear to have been foreign-born, per analysis cited by Reuters from Brean Capital. Models that treat participation declines as unambiguously bearish will misprice this regime. For broader context on how supply shocks interact with AI capex cycles, see our analysis of the AI capex vs GDP divergence.
Bear Steepener vs Bull Steepener: The Curve Is Telling Two Stories
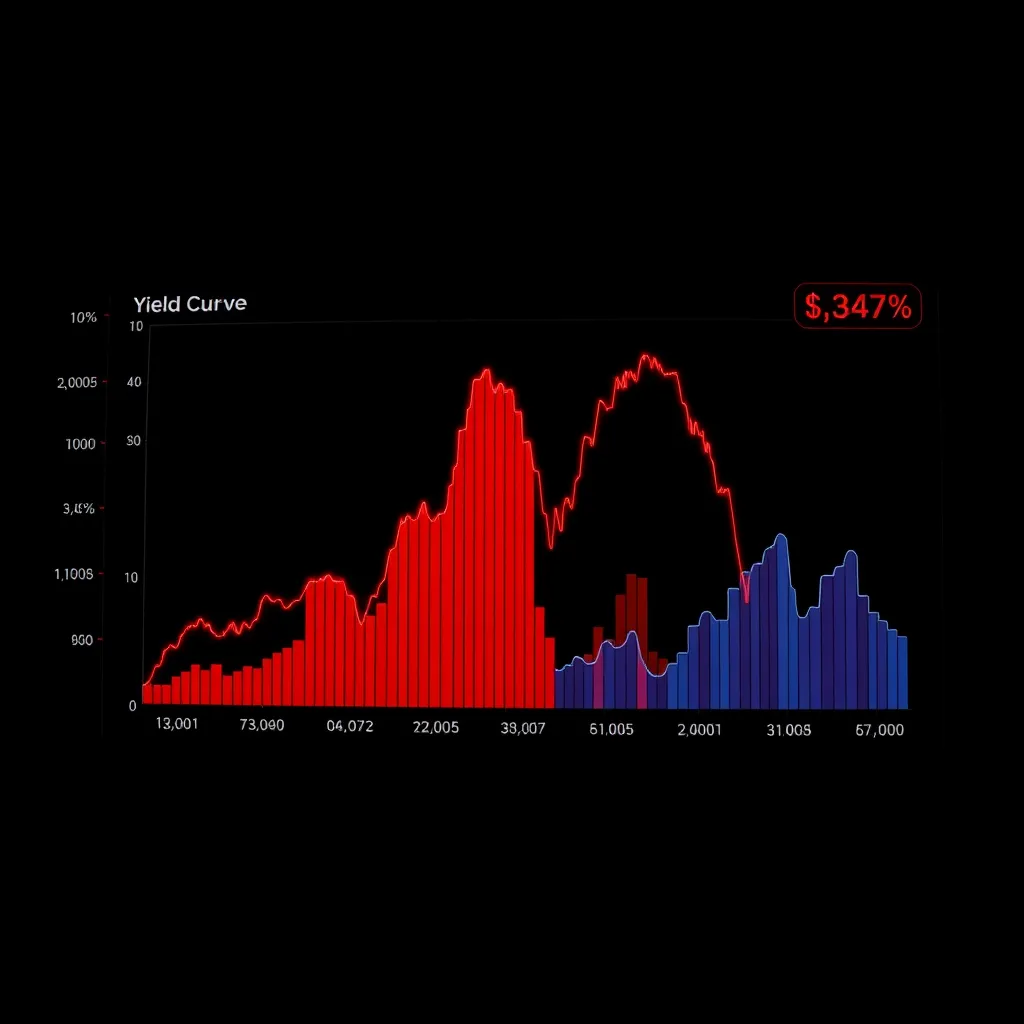
The 10-year Treasury yield sits near 4.69% as of early August, with the 10Y-2Y spread at a positive 35-54 basis points — territory that historically signals growth expectations. But the mechanism driving this steepening is a bear steepener, not a bull steepener. In a bear steepening, long-end yields rise because investors demand higher term premium amid fiscal concerns, not because they expect near-term rate cuts. The market-implied probability of a September rate hike fell from 57% to 44% after the jobs report, per LSEG data referenced in Reuters.
For duration-sensitive quant strategies, this distinction is critical. A bull steepener — where short rates fall faster than long rates — would signal rate-cut expectations and favor duration extension. The current bear steepener does the opposite: it reflects term premium repricing from fiscal deficits and supply issuance. Fixed-income factor models that treat all steepening as recessionary signals will misallocate. The FOMC’s July 29 statement — which passed 9-3 with three dissenters wanting a hike — reinforces that the committee sees inflation as sticky, with CPI still at 3.5% for the 12 months ending June 2026.
The Slow Hire, Slow Fire Dynamic
Temporary layoffs surged by 153,000 to 921,000 in July, while permanent job losers changed little at 1.7 million, per BLS data. This pattern — where employers use temporary reductions rather than permanent separations — defines a “slow hire, slow fire” regime. Wage growth decelerated to 3.2% year-over-year from 3.4%, with average hourly earnings at $37.62, confirming gradual cooling without an acute break.
Quant models that rely on initial jobless claims or permanent separation data as their primary labor market signal may underdetect this regime. The temporary layoff series, which spiked to 921,000, is a leading indicator that traditional unemployment metrics miss [BLS]. Models should incorporate temporary layoff filings as a feature, weighted alongside continuing claims and the employment-to-population ratio (now at 58.9%, near a five-year low). The diffused signal from these cross-metrics creates a noisier environment for systematic strategies.
Sector Rotation Signals for Quant Models
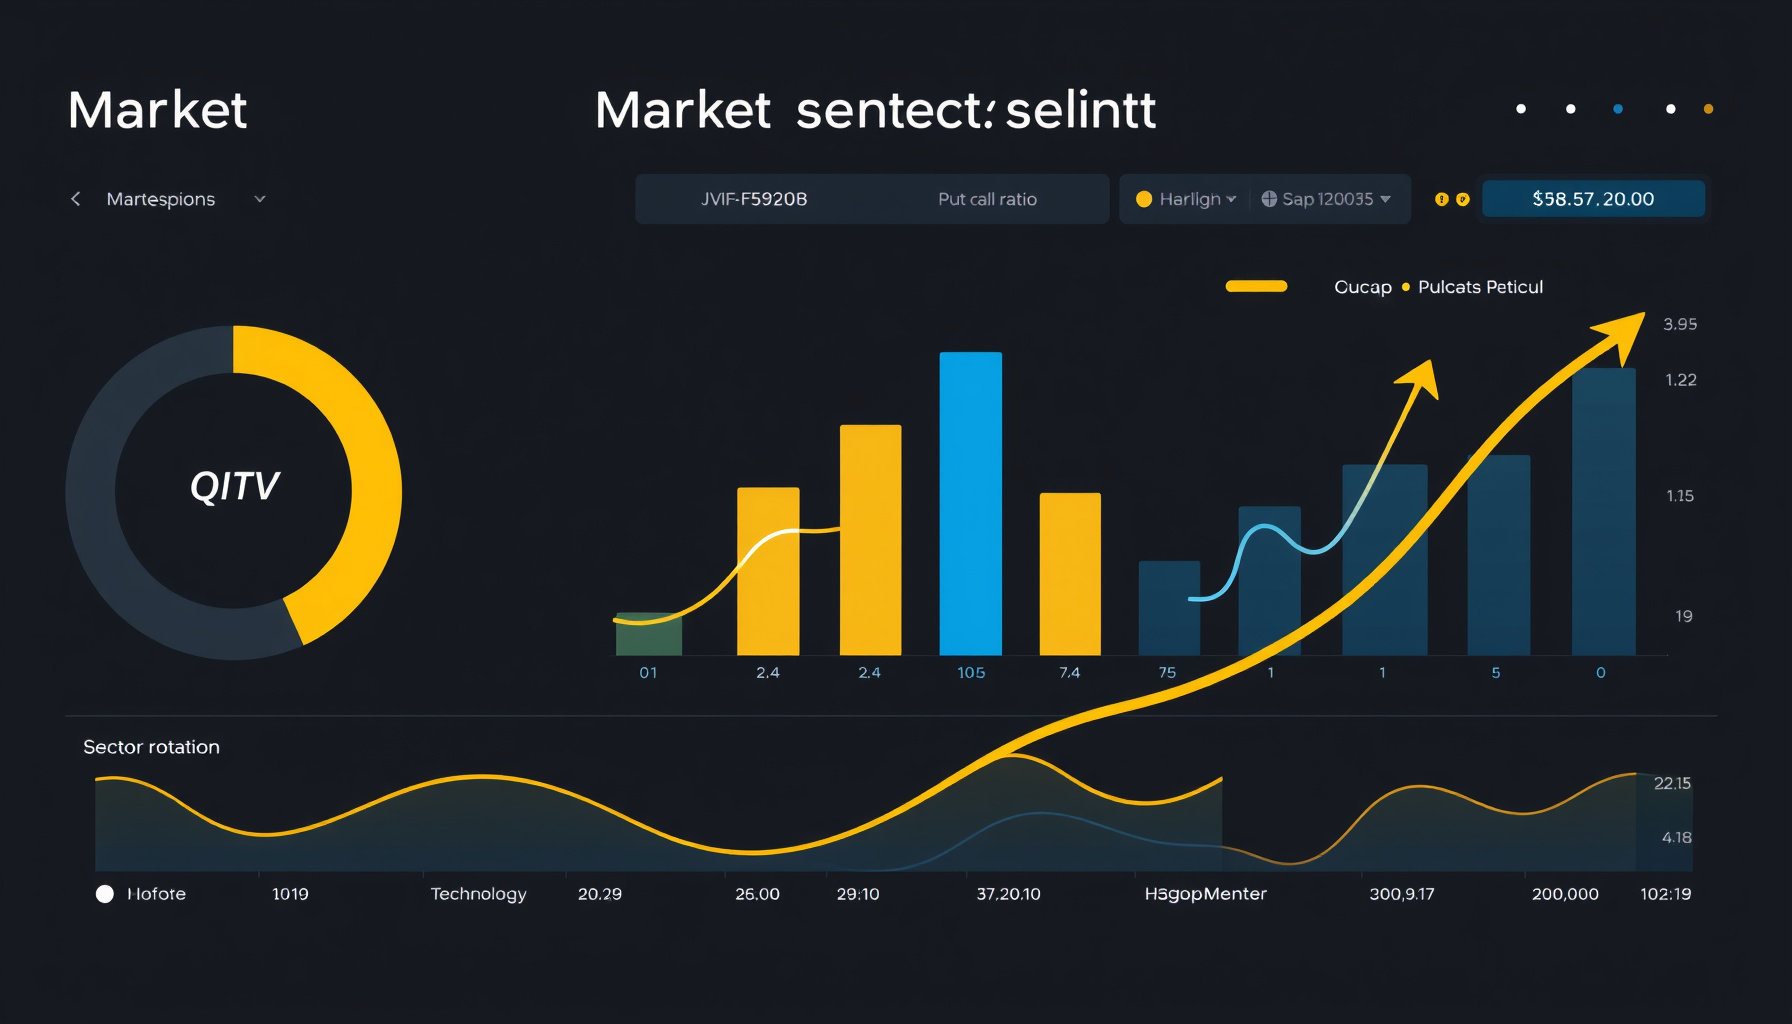
Sector-level payroll data reveals clear divergence. Financial activities lost 14,000 jobs in July, extending a 121,000 decline since a May 2025 peak — a structural contraction in traditional financial intermediation. Healthcare added 22,000 jobs (though below its 36,000 12-month average) and construction added 22,000. Manufacturing gained 5,000, likely driven by AI infrastructure buildout. Leisure and hospitality shed 40,000 as the FIFA World Cup boost faded.
For sector rotation models, the signal is a tilt away from financials toward AI-adjacent industrials and healthcare. Local government education alone lost 50,000 jobs — the most since October 2021 — suggesting public sector austerity is compounding private weakness. Private payrolls excluding government rose just 30,000, matching June’s gain. The June macro outlook anticipated some of this divergence, and the July data confirms the rotation is accelerating.
What This Means for Quant Strategy Positioning
The July report creates a challenging environment for models trained on historical relationships. The headline miss suggests weakness, but the participation collapse and bear steepener point to supply constraints and fiscal dynamics rather than demand destruction. The S&P 500 closed at a record 7,757.64 on August 7, up 0.62%, per CNBC — investors are pricing AI productivity gains that offset labor market softness.
Three positioning implications emerge. First, reduce reliance on headline payroll surprises as a directional signal when participation is declining — the denominator effect distorts the signal. Second, decompose yield curve movements into term-premium-driven and expectations-driven components before adjusting duration. Third, overweight sectors with stable demand (healthcare, construction, AI-adjacent manufacturing) relative to financials and cyclical consumer sectors. The weekly market pulse from August 2 noted the Fed’s split vote and rising yields — the July jobs data adds labor market weakness to that picture.
FAQ
How does the participation rate decline affect GDP growth estimates?
The participation rate drop mechanically reduces potential labor supply, lowering potential GDP growth. With 264,000 workers exiting in July alone and over one million leaving in 2026, the economy’s productive capacity has shrunk. The same GDP growth rate now generates more inflation pressure than historical models predict, because the output gap closes faster with fewer workers. The BLS reports the participation rate at 61.4%, the lowest since February 2021.
Should quant models treat the bear steepener differently from a bull steepener?
Yes — the two carry opposite implications. A bull steepener signals rate-cut expectations and economic weakness, favoring duration extension. A bear steepener reflects term premium increases from fiscal concerns or inflation expectations, which can coexist with strong nominal growth. Models must distinguish between them before adjusting positioning, or they risk buying long bonds into rising yields. The Federal Reserve held rates at 3.50%-3.75% with three hawkish dissents.
What sectors should factor-based strategies overweight given this report?
The data suggests overweighting healthcare and construction, which each added 22,000 jobs, while underweighting financial activities, down 121,000 since May 2025. Manufacturing gains of 5,000, likely driven by AI infrastructure buildout, suggest selective technology exposure. However, the participation rate collapse introduces uncertainty that argues for reduced factor concentration overall.
← Back to all posts