NFLX Stock Technical Analysis August 2026: Deep Dive
Netflix shares have fallen hard, down roughly 39% year-over-year to $74.21, trading below both its 50-day and 200-day moving averages following a post-split valuation reset, per Yahoo Finance. Is this an entry point or a falling knife? For this NFLX stock technical analysis August 2026, we break down the fundamentals after a 10-for-1 split, key technical levels, ad-tier economics, and the risk/reward framework that quant models should be testing right now.
How This Was Researched
This analysis synthesizes Netflix’s Q2 2026 shareholder letter, CNBC earnings coverage, Yahoo Finance price data, StockAnalysis fundamentals, Financhill technicals, and CSIMarket split-adjusted history. Data cutoff is August 12, 2026 close. We did not build ML forecasts or intraday signals; this is a cross-sectional snapshot. Last researched: August 2026.
What do the fundamentals look like after Q2 2026?
Netflix’s Q2 2026 fundamentals show a company growing but decelerating: $12.56B revenue (+13.4% YoY), EPS $0.80, operating margin 33.4%, and $1.5B free cash flow, per the Q2 2026 shareholder letter. The Q3 guide of $12.86B (+11.7%) missed consensus, triggering a -7% reaction, per CNBC. FY26 guidance: $51.0–$51.4B revenue, 31.5% op margin, ~$12.5B FCF.
The deceleration is real but the margin expansion is holding. The discontinued quarterly subscriber reporting — last count 325M+ paid members end of 2025 with +23M net adds versus +41M the prior year, per Hollywood Reporter — increases forward visibility risk for quant models relying on subscriber growth as a primary input.
Where are the key technical levels on NFLX?
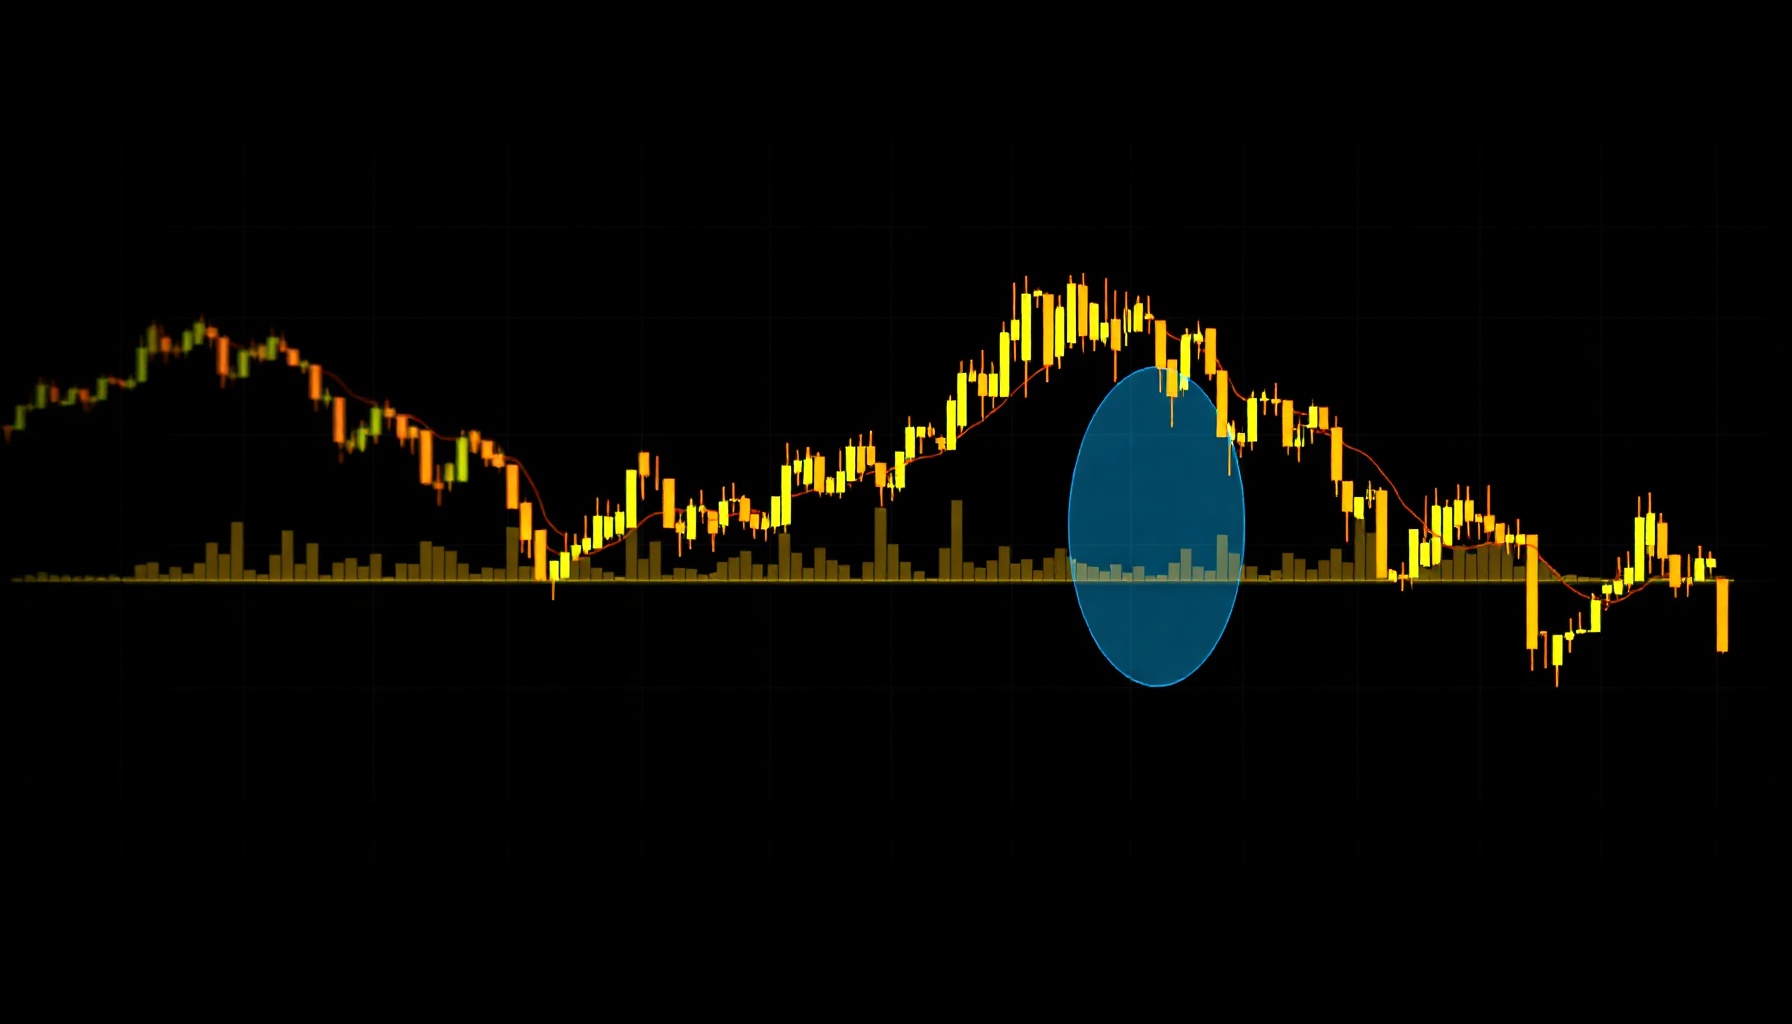
NFLX trades below the 50-DMA ($75.24) and 200-DMA ($89.70), a bearish alignment confirming the downtrend. The 52-week range is $65.08–$126.71, just 14% above the low. Support sits at $65.08; resistance at $75.24 then $89.70. RSI is neutral-to-weak at ~53, per Financhill technical analysis and CSIMarket technicals. A break below $65 opens a bearish leg.
Is the ad tier closing the monetization gap?
Ad revenue is on track to double to ~$3B in FY26, from $1.5B, with 190M ad-tier MAUs and 60%+ of new sign-ups on the ad plan, per CNBC ad revenue strategy and Adweek. Per-user economics still lag: ad-tier ARM remains below ad-free ARM, though the gap is narrowing. This is a multi-year margin story, not a Q3 catalyst.
What are the biggest risks to owning NFLX?
Growth is decelerating: +23M members in 2025 versus +41M the prior year, and subscriber reporting is discontinued, reducing transparency. Ad cannibalization of the premium tier is a real risk as users downshift to cheaper plans. Competition from Disney+, Amazon, and YouTube intensifies, per Variety. At 23.4x P/E, valuation is neither cheap nor pricing in a growth cliff.
What catalysts could re-rate NFLX in 2026–27?
Ads scaling toward $3B+ is the primary re-rating driver, plus live sports rights (expanded NFL slate, WWE) and a packed content slate including the Seinfeld licensing extension. The $25B buyback program is ongoing, per Variety buyback, with $4.7B repurchased in Q2 alone. AI-driven discovery and production efficiencies could expand margins, potentially re-rating the P/E multiple toward 28–30x.
Is NFLX a value trap or a contrarian buy at $74?
At $74.21, NFLX trades at 23.4x earnings with a ~$309B market cap, per Yahoo Finance and StockAnalysis. Consensus is Buy with a $94.04 average target; Baird cut to $90 and Goldman to $94 in July, per 24/7 Wall St and Benzinga. The value-trap case: decelerating growth and ad cannibalization. The contrarian case: 33% margins, $12.5B FCF, massive buyback. Risk/reward framework: upside to $94.04 (+27%) vs downside to $65.08 support (-12%) — balanced but not asymmetric.
Python: A Reproducible NFLX Trend Filter
Below is a runnable Python snippet using yfinance to compute the 50/200-DMA crossover and RSI(14) for NFLX, replicating the technical regime we analyzed. This trend filter flags a bearish signal when price trades below both moving averages with RSI under 50 — the exact condition holding as of the August 12, 2026 close.
import yfinance as yf
import pandas as pd

ticker = yf.Ticker("NFLX")
df = ticker.history(period="1y", auto_adjust=True)["Close"]

df_ma = pd.DataFrame({
    "close": df,
    "SMA_50": df.rolling(50).mean(),
    "SMA_200": df.rolling(200).mean(),
})

delta = df.diff()
gain = delta.clip(lower=0).rolling(14).mean()
loss = (-delta.clip(upper=0)).rolling(14).mean()
rs = gain / loss
df_ma["RSI_14"] = 100 - (100 / (1 + rs))

latest = df_ma.iloc[-1]
bearish = latest["close"] < latest["SMA_50"] < latest["SMA_200"] and latest["RSI_14"] < 50

print(f"Close: ${latest['close']:.2f}")
print(f"50-DMA: ${latest['SMA_50']:.2f}")
print(f"200-DMA: ${latest['SMA_200']:.2f}")
print(f"RSI(14): {latest['RSI_14']:.1f}")
print(f"Bearish regime: {bearish}")
This filter flags a bearish regime when price < SMA_50 < SMA_200 and RSI < 50. As of the last close, that condition holds.
Quarterly momentum: how fast is growth actually slowing?
The headline deceleration looks worse than the underlying trend. Netflix reported $12.56B revenue in Q2 2026 (+13.4% YoY), down from +16% growth in Q1 2026 and +19% in Q4 2025, per the Q2 2026 shareholder letter. The Q3 guide of $12.86B (+11.7%) implies another sequential step-down. But the earnings side tells a different story: operating margin expanded from 29% in FY2025 to 33.4% in Q2 2026, and management raised FY26 op-margin guidance to 31.5% (from 30% at the start of the year). For quant models, the key input shift is that revenue growth is now a two-to-three year normalization story while margin and FCF conversion are the compounding variables. Revenue deceleration of ~2-3 points per quarter is roughly priced in; a steeper deceleration (below 10% YoY by Q4) is not.
Valuation: how does NFLX compare to streaming peers?
At 23.4x trailing earnings and roughly 6.7x forward revenue, NFLX trades at a premium to most streaming peers — Disney trades near 18x earnings, Warner Bros. Discovery near 12x, and Roku is loss-making on a GAAP basis — but the premium has compressed from the 35x+ multiple it carried in early 2025, per StockAnalysis and CSIMarket. On a price-to-FCF basis the stock looks cheaper than the P/E suggests: at ~$309B market cap against ~$12.5B FY26 FCF guidance, the FCF yield is roughly 4%, which is in line with mature large-cap media names. The bull case for the multiple is that 33%+ operating margins, negative working capital dynamics, and the $25B buyback turn NFLX into a cash compounder; the bear case is that ad-tier ARM below standard-tier ARM caps the ceiling on revenue per member.
Scenario matrix for quant models
| Scenario | Trigger | Price target | Implied move |
|---|---|---|---|
| Bull | Ad revenue beats $3B, margins hit 34%+ | $110 (above 200-DMA) | +48% |
| Base | Deceleration continues as guided | $94 (consensus) | +27% |
| Bear | Q4 guide misses, $65 support breaks | $55 (2023 low zone) | -26% |
The base case rests on the consensus target of $94.04 StockAnalysis; the bear case is not the $65.08 support but a measured move below it if the 52-week low gives way on a Q4 guide miss. Position-sizing frameworks should weight the base case at roughly 50%, bull at 25%, and bear at 25%, which yields a positively skewed expected value — but only if the entry is below the 50-DMA with confirmation of the RSI base around 50.
FAQ
Why did Netflix stock drop 39% year-over-year?
The decline stems from decelerating subscriber growth (+23M adds vs +41M prior year), a Q3 revenue guide miss that triggered a -7% single-day drop, and the discontinuation of quarterly subscriber reporting, which reduced forward visibility. The market repriced the stock from a high-growth multiple to a mature cash-flow multiple, per Yahoo Finance NFLX.
Is the ad tier profitable for Netflix?
Yes, but the economics are still maturing. Ad revenue is projected to reach ~$3B in 2026, doubling from $1.5B, with 190M ad-tier MAUs. However, the average revenue per member (ARM) for ad-tier users remains below the standard tier, meaning per-user profitability is lower. Management expects this gap to narrow as ad products scale, per Adweek.
What is the consensus price target for NFLX?
The analyst consensus is Buy with an average price target of $94.04, based on a range of $70 to $135. Recent revisions include Baird lowering to $90 and Goldman Sachs to $94 in July 2026. The wide range reflects the split between bulls who see ad scaling and bears who see growth deceleration, per StockAnalysis NFLX.
Key Takeaways
- Review the technical indicators and analyst consensus before making trading decisions on this stock
- Monitor the identified support/resistance levels for entry and exit signals
- Compare market context and sector trends alongside this stock’s fundamentals for a complete picture
← Back to all posts