Vistra Stock Analysis: AI Power Demand and Valuation Outlook
Vistra stock analysis at $139.81 (Aug 27, 2026 close) reveals a compelling tension: record EBITDA against a 38% drawdown from its 52-week high. This post evaluates whether VST is a buy for AI power demand by examining earnings, valuation, technicals, and the catalysts driving its long-term growth story.
How This Was Researched
This analysis is based on official filings, company press releases, and market data aggregators — we did not trade this stock. Primary sources include Vistra IR press releases (investor.vistracorp.com), stockanalysis.com, Meta newsroom, Reuters, altindex.com, ts2.tech, and Motley Fool. We reviewed public earnings releases, analyst compilations, and market data. Options implied volatility was excluded due to captcha-blocked sources, and proprietary trading signals were not used. Last researched: August 2026.
Is Vistra Stock a Buy for AI Power Demand?
Yes, with caveats. Vistra holds 3,809 MW of signed hyperscaler PPAs (Meta 2,609 MW + Amazon 1,200 MW), the Cogentrix acquisition adds 5,496 MW, and the Helix JV with KKR/NVIDIA brings over $10B in digital infrastructure investment. Goldman Sachs projects U.S. data-center demand doubling to 66 GW by 2027. However, the stock is down 15.6% YTD on rate fears — a valuation opportunity if growth materializes.
Vistra’s Integrated Business Model
Vistra operates five segments: Retail, Texas, East, West, and Asset Closure. Its retail arm (TXU Energy) serves millions of customers while the generation fleet of ~37 GW grows to ~50,000 MW post-Cogentrix. The fuel mix spans gas, nuclear, coal, solar, and battery storage. With TTM revenue of $19.21B, this integrated model hedges retail against wholesale volatility — a structural advantage over pure generators.
Q2 2026 Earnings Breakdown
Q2 2026 delivered Adjusted EBITDA of $1,767M, up 31% YoY, though GAAP net income fell to $305M from $327M on a $472M unrealized hedge loss. Revenue of $4,017M missed the ~$5.7B consensus. H1 2026 Adjusted EBITDA reached $3,261M. Segment highlights: Retail EBITDA $773M, Texas $311M (+119%), and East $642M (+54%). Vistra Q2 2026 Earnings Release
2026 Guidance and Hedging Position
Management guides 2026 Ongoing Operations Adjusted EBITDA of $6.8–7.6B and Adjusted FCFbG of $3.925–4.725B, per the Vistra Q2 2026 Earnings Release. The 2027 midpoint of $7.4–7.8B excludes Cogentrix and Meta PPAs — meaning upside is deliberately understated. Critically, Vistra has hedged 100% of 2026 generation, 94% of 2027, and 72% of 2028, locking in margins while reducing earnings volatility.
AI and Data-Center Catalysts
The AI power thesis rests on contracted demand: Meta signed 20-year nuclear PPAs totaling 2,609 MW across Perry and Davis-Besse, with purchases starting late 2026 and ramping fully by 2034. Amazon added 1,200 MW of carbon-free power. The Cogentrix acquisition (~$4.0B, 5,496 MW, 10 gas plants, FERC approved, closing mid-to-late 2026) adds ~7.25x 2027E EBITDA. Helix Digital Infrastructure (>$10B with KKR/NVIDIA/KIA, Vistra committing up to $1.0B) positions Vistra as preferred power provider for AI compute. Vistra–Meta Nuclear PPA Announcement Meta Newsroom: Nuclear Energy Projects
Valuation Snapshot
At $139.81, VST trades at a forward P/E of 13.58 and EV/EBITDA of 10.08 (TTM), with EV of $67.0B and P/FCF of 20.81, per StockAnalysis ratio data. Returns metrics are strong: ROE 42.96%, debt/EBITDA 3.09x, net debt ~$20.07B, and total liquidity $6.295B. Consensus estimates 2027E EPS of $10.56 and 2028E EPS of $12.36, implying meaningful earnings growth ahead. VST quote
Quant Corner: Quick Valuation Check
# Forward EV/EBITDA comparison for VST
ev = 67.0  # billion USD
ebitda_ttm = ev / 10.08  # derive from TTM multiple
midpoint_2026 = 7.2  # guidance midpoint, billion USD

fwd_ev_ebitda = ev / midpoint_2026

print(f"TTM EV/EBITDA: {ev / ebitda_ttm:.2f}x")
print(f"Forward EV/EBITDA (2026E): {fwd_ev_ebitda:.2f}x")
print(f"Discount to TTM: {(1 - fwd_ev_ebitda / (ev / ebitda_ttm)) * 100:.1f}%")
print("\nValuation Comparison:")
print(f"{'Metric':<25} {'Multiple':<12}")
print(f"{'TTM EV/EBITDA':<25} {ev / ebitda_ttm:.2f}x")
print(f"{'2026E EV/EBITDA':<25} {fwd_ev_ebitda:.2f}x")
The output shows the forward multiple compressing roughly 29% below TTM on guidance midpoint, before any Cogentrix EBITDA contribution is included. That compression is the mathematical core of the bull case: the market is paying a lower multiple on earnings that already exclude two major catalysts.
Technical Picture
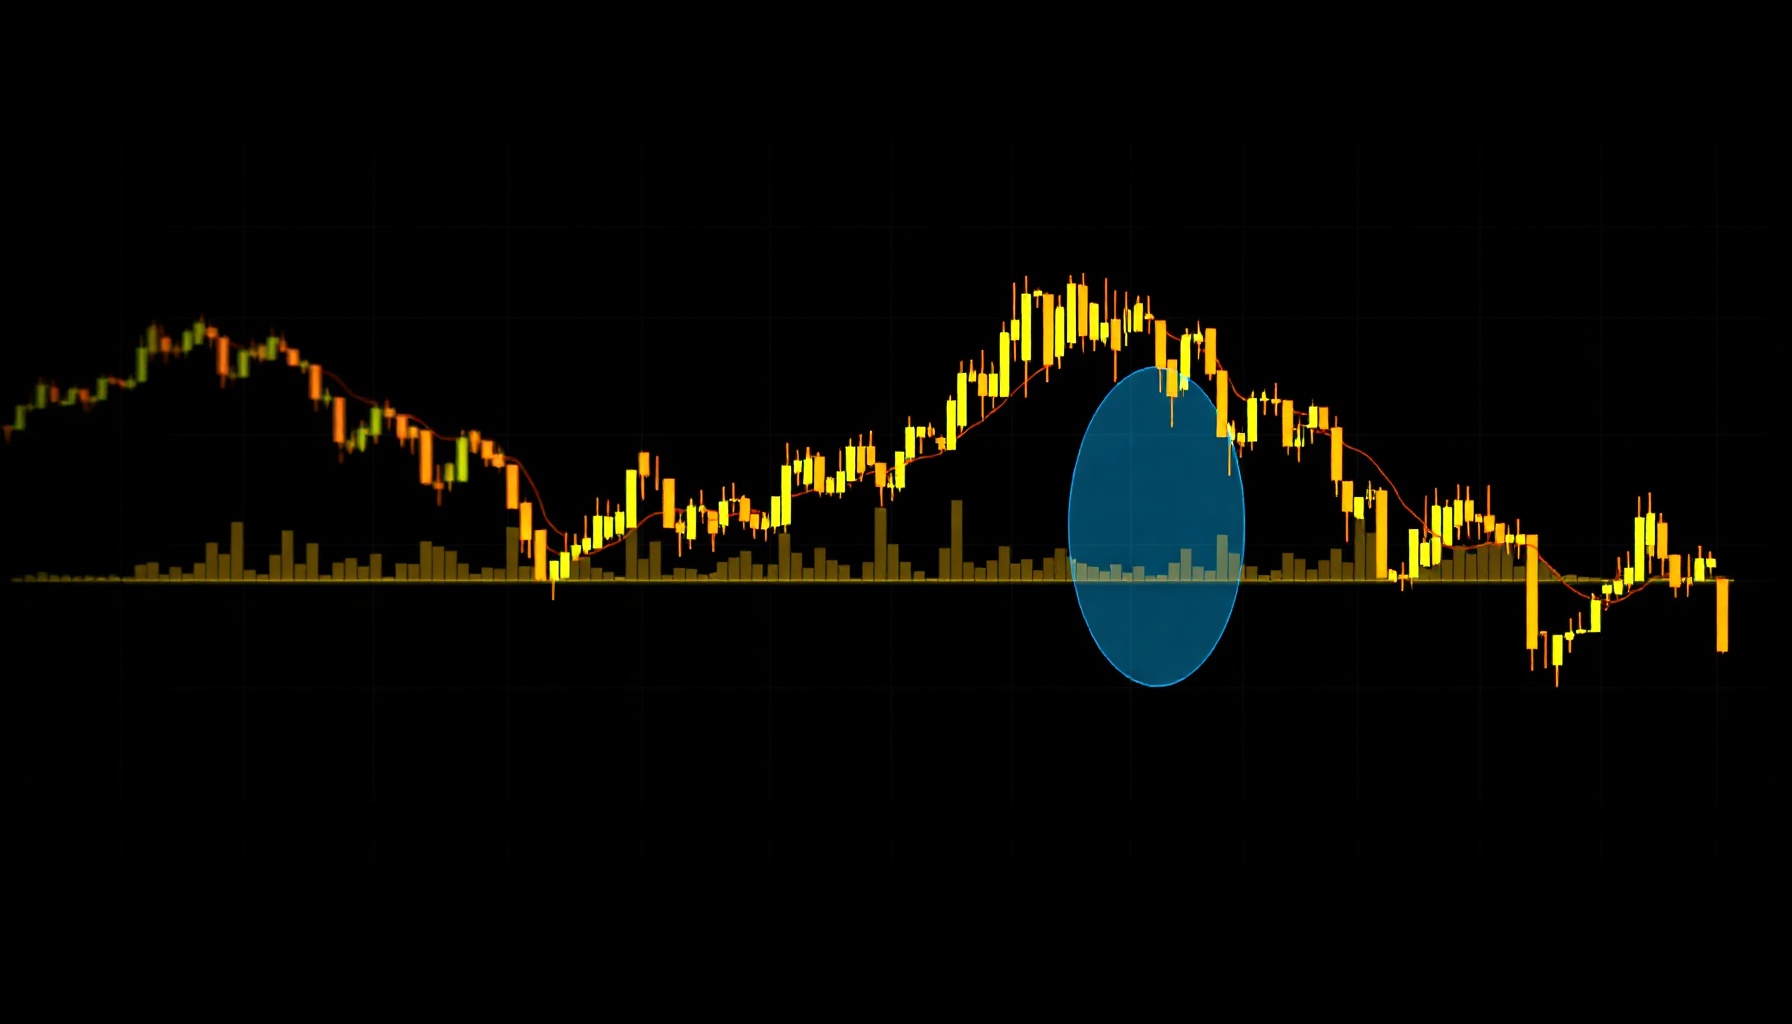
The chart is bearish short-term: price sits below the 50-day SMA ($149.60) and 200-day SMA ($155.40), with a death cross confirmed. RSI(14) at 42.9 shows weakness but not oversold; MACD at −3.1 shows a bullish cross forming. ATR(14) of 1.7 indicates low volatility. Support is $134.53, resistance $169.62, within a 52-week range of $132.66–$219.82. Beta is 1.43. AltIndex technical analysis
Risks to Monitor
Five risks warrant attention: (1) ERCOT weather exposure and battery-curbed scarcity pricing; (2) interest rates — the 10-yr at ~4.71% is compressing long-duration AI-power valuations, the primary driver of the ~$4B weekly selloff; (3) hedge-mark GAAP noise ($472M unrealized Q2 loss); (4) renewables and battery buildout pressuring wholesale margins; (5) the WSJ sentiment shift on “Red-Hot Power Stocks Losing Steam.” Reuters: Vistra Q2 Profit
What Analysts Are Saying
Consensus is Strong Buy across 20 analysts with an average price target of $217.42 (+55.5% upside), per StockAnalysis analyst data. Recent actions: Mizuho initiated Outperform at $169 (Aug 24), Morgan Stanley raised to $227 Overweight (Aug 21), DBS Buy at $216 (Aug 20), BNP Paribas $255 Outperform (Aug 19), Goldman Sachs $206 Buy (Aug 17), BofA raised to $220 (Aug 14). CEO Jim Burke bought 2,000 shares ($270K) on Aug 24, per TheFly/TipRanks, signaling insider conviction.
Vistra vs. Other AI Power Names
Vistra is not the only IPP riding the data-center demand wave, and the comparison matters for positioning. Constellation (CEG) trades as the nuclear pure-play, with its own hyperscaler PPAs and a premium multiple. Talen Energy (TLN) monetized merchant capacity via its AWS data-center campus. Vistra’s differentiator is the retail franchise: TXU Energy’s millions of customers and its hedged book give it cash-flow visibility that merchant-exposed peers lack, which is why the 2026 guidance is backstopped by 100% hedged generation, per the Vistra Q2 2026 Earnings Release. That structure makes VST closer to a regulated utility with AI upside than to a pure merchant generator — lower beta to power prices, but also less upside if spot power spikes. Our utilities sector spotlight covers the broader group.
Bottom Line
For investors weighing Vistra, the bull case rests on contracted AI power demand: roughly 3.8 GW of signed hyperscaler PPAs, a Cogentrix deal that expands the fleet to about 50 GW, and a Helix joint venture funded at over $10 billion. The bear case is equally concrete: rate-sensitive valuations, a 38% drawdown from the high, and hedged margins that cap near-term earnings upside. At $139.81, the stock trades at roughly 13.6x forward earnings with a 0.66% dividend yield, and the Street sees about 55% upside to the average target.
The 100% hedge on 2026 generation makes the guidance dependable, while 2027 and beyond offer the real upside if data-center demand ramps as contracted. Retail EBITDA of $773M and East segment growth of 54% show the non-hedge engines are compounding, while Texas scarcity pricing added $311M in the quarter. Key dates to watch include the September 21 ex-dividend date, the Cogentrix closing, and quarterly prints that confirm the 2027 guidance path.
We view VST as a watchlist name rather than an urgent buy: valuation is fair, catalysts are real, and the market’s rate fears create patience for a better entry. We did not trade this stock.
FAQ
What is Vistra’s dividend and yield?
Vistra pays a quarterly dividend of $0.23 per share, annualizing to $0.92, for a yield of 0.66% at the current price, per Vistra dividend data. The ex-dividend date is September 21, 2026, with a payout ratio of 15.6% — leaving ample room for growth.
Why is Vistra stock down in August 2026?
The primary driver is the 10-year Treasury at ~4.71%, which compresses long-duration AI-power valuations. A WSJ sentiment piece and Lone Pine Capital’s exit (13F filing) added pressure. The week of Aug 17–21 erased ~$4B in market cap despite strong fundamentals, as ts2.tech noted.
How much has Vistra spent on share buybacks?
Vistra has spent ~$6.5B on buybacks since November 2021, reducing share count by ~30% to ~336M shares. Approximately $1.2B in authorization remains, supporting per-share earnings growth.
For more context, explore our full research library, including our August 2026 utilities sector spotlight and AI semiconductor demand trends.
← Back to all posts