AI Data Center Power Analysis: Utility Stock Supercycle
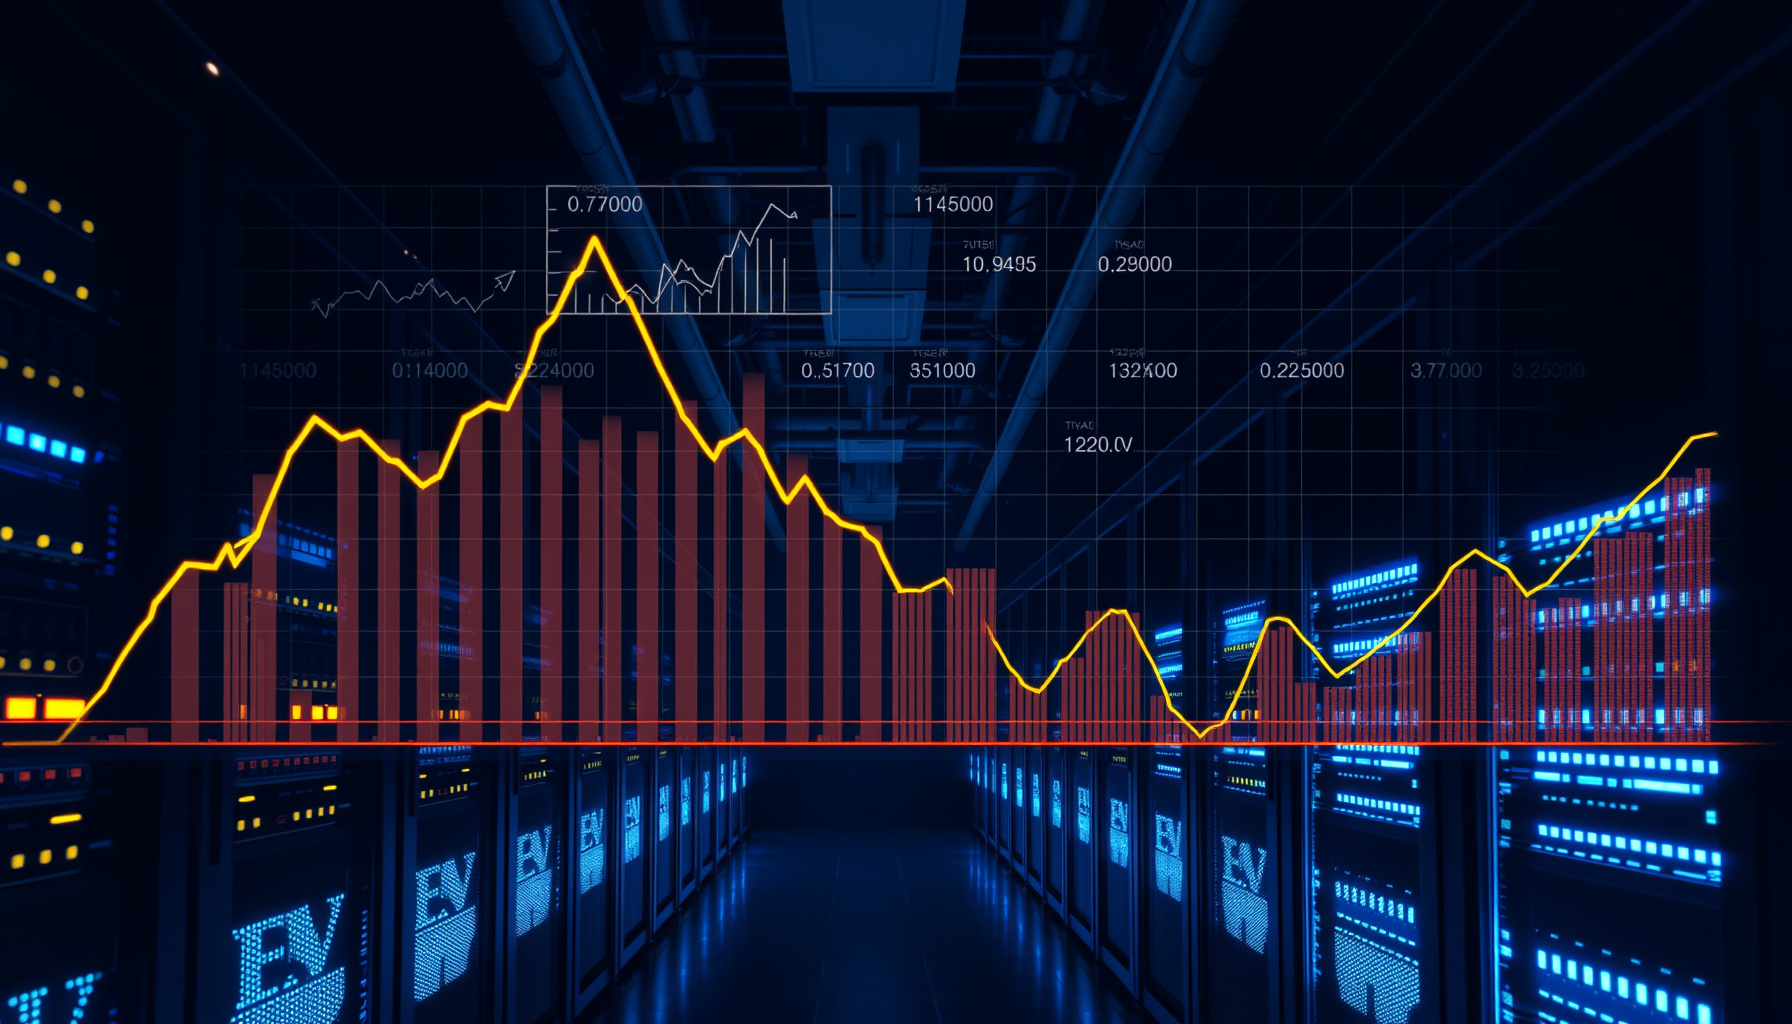
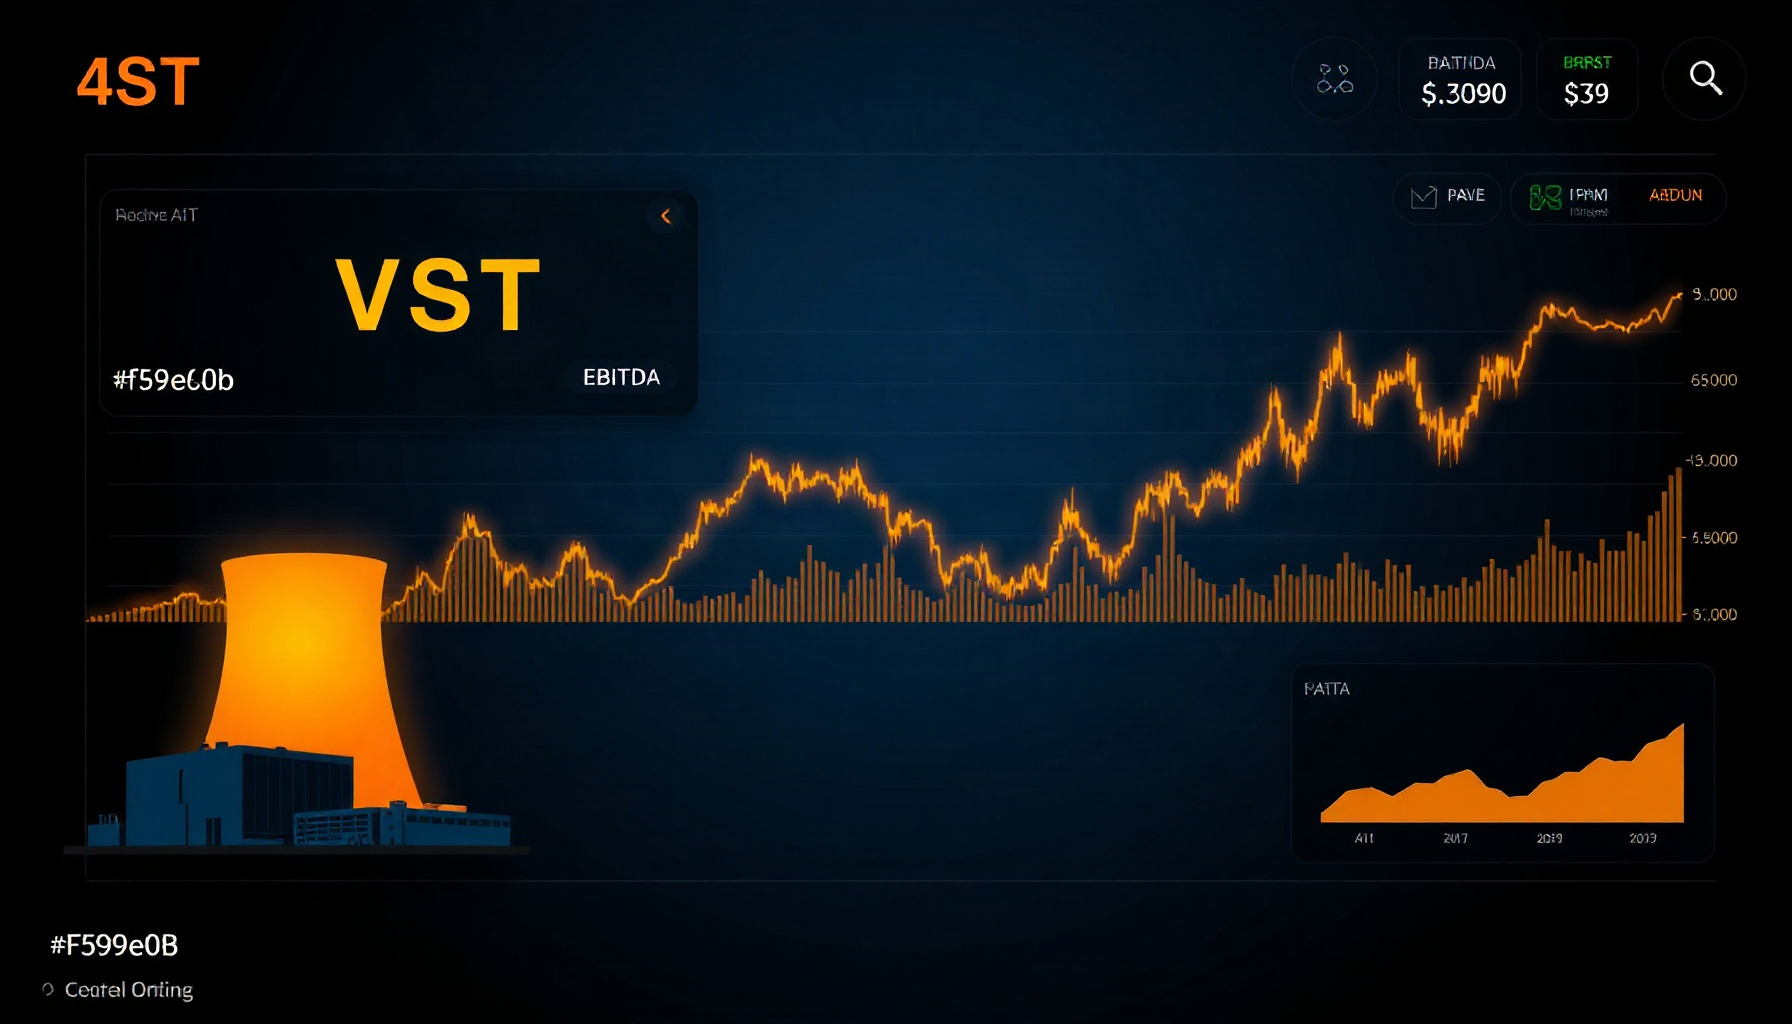
The AI data center power demand utility stocks 2026 theme is no longer a narrative — it is a quantifiable earnings tailwind visible in PPA backlogs, capacity forecasts, and analyst revisions. For traders and ML engineers, the question is not whether the demand exists, but how to systematically rank the beneficiaries. This analysis breaks down the fundamentals for Vistra (VST), Constellation Energy (CEG), NextEra Energy (NEE), and Talen Energy (TLN) against the broader XLU benchmark.
How This Was Researched
This analysis synthesizes data from the US Energy Information Administration (EIA) January 2026 Short-Term Energy Outlook, the International Energy Agency (IEA) Electricity 2026 report, FERC filings, and company investor presentations. Methodology focused on demand forecast triangulation, PPA backlog valuation, and relative strength vs the XLU ETF. We excluded ML price prediction models and intraday trading setups. Last researched: August 2026.
What is the AI data center power demand supercycle?
The AI data center power demand supercycle is a multi-year structural increase in US electricity consumption driven by hyperscaler AI compute buildouts, with the EIA forecasting the strongest four-year demand growth since 2000. The EIA expects US electricity use to grow 1% in 2026 and 3% in 2027, directly attributable to data center load EIA Press Release. This creates a durable revenue pipeline for utilities with contracted capacity.
Which utility stocks benefit from AI data center power demand in 2026?
The utility stocks benefiting most are those with nuclear and gas assets co-located with data centers, specifically Vistra, Constellation, and Talen, as they can sign long-term PPAs at premium rates. Constellation and Vistra are direct competitors in this space, with Constellation’s nuclear fleet offering carbon-free baseload power that hyperscalers increasingly demand Motley Fool Comparison. NextEra benefits via its renewable buildout and grid-scale storage.
How large is the projected data center electricity demand by 2030?
Global data center electricity consumption is projected to rise to about 945 TWh by 2030, up from 415 TWh in 2024, representing a 128% increase over six years. This IEA projection underscores the scale of the demand shock hitting utility grids IEA Electricity 2026. For US utilities, this translates into a need for 35 GW of new capacity by 2027, creating a seller’s market for power.
What is the US data center power demand forecast for 2027?
US data center power demand is forecast to jump from 31 GW in 2025 to 66 GW by 2027, a doubling in just two years. This Goldman Sachs Research estimate implies a compound annual growth rate exceeding 45%, far outpacing the 2% baseline electricity growth Goldman Sachs via Coradvisors. For utilities, this means capacity is the constraint, not demand.
How do long-term PPAs create earnings visibility for utilities?
Long-term PPAs provide predictable revenue streams that shield utilities from spot price volatility, converting the AI demand boom into contracted, bankable cash flows. Vistra’s PPA strategy, for example, locks in multi-year pricing with hyperscalers, reducing earnings variance and supporting upward revisions TradingView/Zacks Analysis. For quant models, PPA backlog growth is a leading indicator for forward EPS.
What are the PPA backlogs and capacity GW forecasts for VST, CEG, NEE, TLN?
Each of the four spotlight utilities has disclosed data center PPAs or contracted capacity in their recent investor presentations, though exact GW figures vary by disclosure. Vistra and Constellation have signed multi-billion-dollar agreements with hyperscalers for nuclear and gas-fired power, while Talen’s Susquehanna nuclear facility has a direct data center interconnection. NextEra’s pipeline leans toward utility-scale solar and storage PPAs tied to tech buyers. For current contract details, consult each company’s latest investor relations materials and FERC filings.
How are earnings revisions trending for these utility stocks?
Earnings revisions for VST, CEG, and TLN have been positive over the past six months, with consensus estimates trending upward on PPA announcements, while NextEra’s revisions are more moderate given its broader regulated utility base. This revision divergence is a key quant signal: it separates pure-play AI power beneficiaries from diversified utilities. Check live consensus via your preferred estimate provider (Refinitiv, FactSet, or Zacks).
How does relative valuation compare to the XLU benchmark?
On a forward P/E basis, VST, CEG, TLN, and NEE generally trade at a premium to XLU, reflecting the market pricing in data center growth. However, on EV/EBITDA, the merchant generators (VST, TLN) can screen cheaper than the regulated utility average, suggesting the market prices AI power upside inconsistently. Use the Python snippet below to pull live multiples for a current comparison rather than relying on static figures.
Python: Screening Utility Stocks for AI Power Exposure
Below is a runnable script to pull relative strength and valuation data for the four utility stocks versus XLU. It uses yfinance to calculate 90-day momentum and forward P/E, providing a quick quant screen.
import yfinance as yf
import pandas as pd

tickers = ["VST", "CEG", "NEE", "TLN", "XLU"]
data = {}

for t in tickers:
    stock = yf.Ticker(t)
    hist = stock.history(period="6mo")
    if len(hist) >= 90:
        mom_90 = (hist["Close"][-1] / hist["Close"][-90] - 1) * 100
    else:
        mom_90 = float("nan")
    info = stock.info
    data[t] = {
        "Price": hist["Close"][-1],
        "90d_Momentum_%": round(mom_90, 2),
        "Forward_PE": info.get("forwardPE", float("nan")),
    }

df = pd.DataFrame(data).T
df["Rel_Strength_vs_XLU"] = df["90d_Momentum_%"] - df.loc["XLU", "90d_Momentum_%"]
print(df[["Price", "90d_Momentum_%", "Forward_PE", "Rel_Strength_vs_XLU"]].round(2))
Run this to see which names are leading on momentum and whether the market is rewarding PPA visibility. For a broader context on AI infrastructure demand, see our hyperscaler capex outlook and AI semiconductor sector analysis.
What is the biggest risk to the AI utility supercycle thesis?
The biggest risk is a demand-side correction, where hyperscaler AI capex slows or efficiency gains reduce power intensity, leaving utilities with stranded contracted capacity. If Goldman’s 66 GW forecast is revised down materially, PPA renegotiations could hit earnings. However, current FERC interconnection queues suggest demand is real, not speculative.
How should quant traders position for this theme?
Quant traders should focus on relative strength and revision momentum rather than absolute valuation, favoring VST and TLN for their contracted cash flows and higher beta to power prices. A long VST/TLN vs short XLU pair trade captures the AI power premium while hedging sector-wide rate risk. Monitor quarterly PPA announcements as catalysts.
Risk Controls for the Pair Trade
Before entering the long VST/TLN vs short XLU pair, define the exit rules explicitly. A common approach is to exit when the relative-strength spread (VST/TLN momentum minus XLU momentum) compresses below two standard deviations of its 90-day rolling mean, or when either name gaps on a downgrade. Keep position sizing modest — merchant generators are high-beta, so a 1:1 notional pair still carries meaningful single-name risk. Also cap the holding period to one earnings cycle and re-evaluate after each PPA disclosure, since the catalyst calendar, not the price chart, drives this theme. Finally, avoid running the pair through the August liquidity trough without stops, because thin books amplify whipsaws.
FAQ
Are utility stocks with AI data center contracts good long-term investments?
Utility stocks with AI data center contracts offer multi-year earnings visibility, but they trade at premiums reflecting that growth. The key is whether contracted PPAs exceed market expectations. Vistra and Constellation have demonstrated this with upward revisions, but investors must monitor contract renegotiation risk Motley Fool.
How does AI data center power demand affect electricity prices?
AI data center power demand pushes wholesale electricity prices higher in regions with constrained supply, particularly PJM and ERCOT. The EIA’s 3% demand growth forecast for 2027 will tighten reserve margins, supporting higher spot prices and benefiting generators with unhedged capacity EIA. This price effect is a secondary earnings driver beyond contracted PPAs.
What is the difference between Vistra and Constellation for AI power exposure?
Vistra has a larger gas-fired fleet, offering flexibility and faster deployment for new data center load, while Constellation is nuclear-heavy, providing carbon-free baseload power at premium prices. For quant purposes, Vistra has higher earnings beta to power prices, while Constellation offers more stable contracted cash flows Motley Fool.
← Back to all posts