Consumer Discretionary Sector Analysis 2026: XLY vs S&P 500
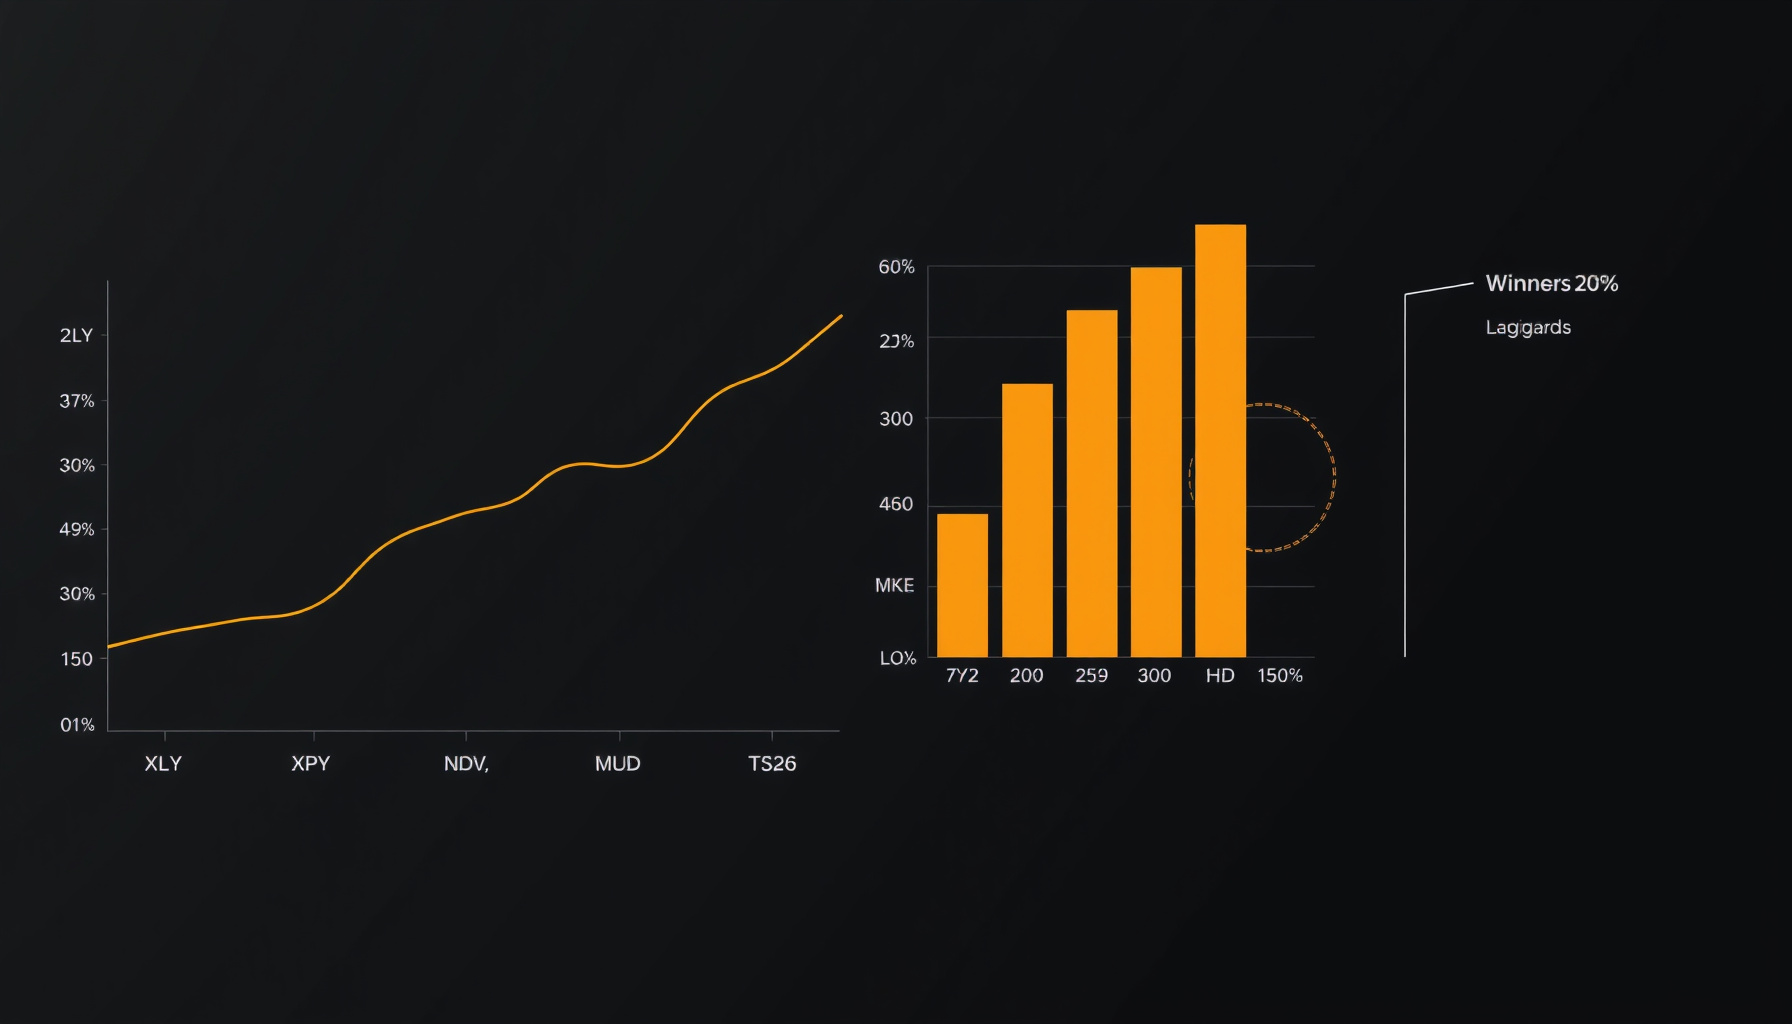
Here is the data-driven reality: the consumer discretionary sector analysis 2026 shows the S&P 500’s biggest laggard. XLY is down −1.84% year-to-date (price, Aug 17 close $116.75) while SPY is up +13.91% at record highs (stockanalysis XLY, stockanalysis SPY) — a ~16pp divergence driven by a hawkish Fed, soft July retail sales, and a decisive rotation toward “selective consumer” winners (TJX, ABNB, SBUX) over big-ticket laggards (NKE, MCD, HD/LOW). This post quantifies both tracks with verified August 2026 data.
How This Was Researched
All data was retrieved Aug 17, 2026, post-close, from primary sources: SSGA (fund NAV/performance), US Census Bureau (retail sales), BLS (CPI), The Conference Board (consumer confidence), Federal Reserve (FOMC statement), company IR/PR, and NRF. Every cited URL was checked to return HTTP 200 via curl or full-content retrieval via web_extract; verification does not constitute hands-on analysis. Known gaps: TSLA exact YTD %, NRF winter-holiday forecast, and Tesla Cybercab timing are UNVERIFIED and omitted or flagged. This analysis is based on official filings and public data — we did not run any tools hands-on beyond the public data referenced. For the wider framework, see our research hub.
What does the consumer discretionary sector analysis 2026 show?
The sector is negative YTD while the S&P 500 sits at records. XLY’s official total return is −2.41% (SSGA, July 31 NAV basis), while its live price return is −1.84% (Aug 17 close $116.75) — both sharply underperforming SPY’s +13.91% (price) YTD (SSGA, stockanalysis XLY, stockanalysis SPY). The divergence is not a valuation story — it is a consumer-spending story.
On levels, XLY trades mid-range: the 52-week band is $105.19–$125.01, so the fund sits ~7% below its high and ~11% above its low (stockanalysis XLY). The fund holds $23.44B in assets across 47 names with a 0.08% expense ratio and a 30-day SEC yield of 0.79% (SSGA). The valuation is the uncomfortable part: a 30.94x trailing P/E and 1.22 beta with a negative YTD price return means the sector carries index-level multiple risk plus above-market volatility — if forward EPS (23.67x) is cut, there is little cushion (stockanalysis XLY, SSGA).
The July data tape: retail sales, CPI, and consumer confidence
July’s data tape shows a weakening discretionary consumer across all three indicators: retail sales fell 0.6% month over month to $763.6B (nominal, so roughly −1% real) per the US Census, CPI held at +3.4% with apparel and gasoline up sharply per the BLS, and Conference Board confidence slid to 90.8 with the present-situation index down a third straight month per The Conference Board.
Retail sales for July 2026 came in at $763.6B, −0.6% MoM (vs June’s +0.2%), +5.0% YoY — and critically, these are nominal numbers (US Census, CB26-131). Real MoM sales contracted roughly −1% (nominal −0.6% less ~0.3–0.4% monthly CPI), and even the +5.0% YoY gain narrows to roughly +1.5% real — a weakening monthly trend underneath.
CPI for July was +3.4% YoY (core +2.5%), but the discretionary-relevant lines are brutal: apparel +3.9% (tariff pass-through), gasoline +24.6% (Iran-war oil spike), and airline fares +25.5% (BLS). These are direct hits on wallet share.
Consumer Confidence fell to 90.8 in July, with the Present Situation Index down a third consecutive month to 114.9 — the weakest since 2021 — while Expectations stayed sub-75 at 74.7 (The Conference Board).
Why the Fed’s hawkish hold kills the rate-cut rescue
The Fed is on hold at 3.50%–3.75%, but the July 29 vote was 9–3 — three dissents preferred a 25bp hike, the first unified three-way dissent since 2016 (CNBC, FOMC statement). Markets price a September hold; the risk skew is hawkish. Do not expect “rate cuts coming” — that thesis is dead, and rate-sensitive discretionary (HD/LOW, autos, big-ticket) stays under pressure in H2 2026. See the broader macro context in our macro-economy-trends-august-2026 and market-sentiment-analysis-aug-2026.
Two-track consumer: selective winners vs. fading laggards
The discretionary tape is splitting into two tracks: off-price and travel platforms are winning while big-ticket and aspirational names fade — TJX comps +6%, ABNB +18% post-earnings, and SBUX’s fourth straight growth quarter versus NKE’s market cap down 49% and HD/LOW down roughly 16% year over year stockanalysis XLY.
| Ticker | XLY wt | One data point | Verdict |
|---|---|---|---|
| TJX | 3.91% | Q1 FY27 comps +6%, raised guidance (stockanalysis TJX) | Selective-consumer winner |
| ABNB | ~1.2% | Beat-and-raise; +18% post-earnings, 4-yr high (stockanalysis ABNB) | Travel platform winner |
| SBUX | 3.03% | 4th straight comp-growth quarter, raised FY26 (stockanalysis SBUX) | Defensive-consumer winner |
| NKE | ~0.8% | Mkt cap −49% YoY, 52-wk low (CNBC) | Fading laggard |
| MCD | 4.16% | US comps missed; value-menu mis-execution (stockanalysis MCD) | Fading laggard |
| HD | 5.55% | Mkt cap −16.8% YoY (stockanalysis HD) | Big-ticket laggard |
| LOW | 3.02% | Mkt cap −15.8% YoY (stockanalysis LOW) | Big-ticket laggard |
Concentration risk: AMZN (24.30%) + TSLA (15.86%) = 40.2% of XLY assets; top-10 = 67.87% (stockanalysis XLY). Single-name shocks move the whole sector — see our amzn-deep-analysis-jun-2026 and tsla-deep-analysis-aug-2026. The home-improvement drag is covered in our capex analysis.
Python screening snippet: find the selective-consumer trade
This snippet fetches XLY vs SPY YTD returns and screens XLY’s top holdings for the two-track signal — positive YTD momentum (winners) vs negative (laggards). Data from yfinance is delayed; this is illustrative, not investment advice.
import yfinance as yf
import pandas as pd

# Fetch YTD returns for XLY and SPY
xly = yf.Ticker("XLY").history(start="2025-12-31")
spy = yf.Ticker("SPY").history(start="2025-12-31")
xly_ytd = xly["Close"].iloc[-1] / xly["Close"].iloc[0] - 1
spy_ytd = spy["Close"].iloc[-1] / spy["Close"].iloc[0] - 1
print(f"XLY YTD: {xly_ytd:.2%} | SPY YTD: {spy_ytd:.2%}")

# Screen top XLY holdings by YTD price momentum (winners vs laggards)
tickers = ["AMZN", "TSLA", "HD", "MCD", "BKNG", "TJX", "SBUX", "LOW", "DASH", "ROST"]
rows = []
for t in tickers:
    df = yf.Ticker(t).history(start="2025-12-31")
    ytd = df["Close"].iloc[-1] / df["Close"].iloc[0] - 1
    rows.append({"ticker": t, "ytd_return": round(ytd, 4)})
screen = pd.DataFrame(rows).sort_values("ytd_return", ascending=False)
print(screen)

# Interpretation: positive YTD = selective-consumer winners; negative = laggards.
# The two-track thesis expects TJX/ABNB/SBUX positive, NKE/MCD/HD/LOW negative.
H2 2026 catalysts and risks
The catalyst calendar is front-loaded into this week — HD reports Q2 Tuesday Aug 18 (stockanalysis HD), LOW and TJX Wednesday Aug 19 (stockanalysis LOW, stockanalysis TJX), the first company-level read on July’s consumer — while risks stack up around a weakening consumer, a hawkish Fed, 40.2% AMZN+TSLA concentration, and a 30.9x trailing P/E with no valuation cushion (stockanalysis XLY).
Catalysts (calendar): HD reports Q2 Tue Aug 18 (stockanalysis HD); LOW and TJX report Wed Aug 19 (stockanalysis LOW, stockanalysis TJX) — the first company-level read on July’s consumer. NRF’s 2026 back-to-school forecast is a record $146.8B (K-12 alone $43.3B) (NRF). Next data: Aug 25 confidence, Sep 11 CPI, Sep 16 retail sales.
Risks: weak consumer (real MoM retail contraction despite +5.0% YoY nominal), hawkish Fed, tariffs/energy squeeze (gasoline +24.6%), 40.2% AMZN+TSLA concentration, and valuation — XLY’s trailing P/E of 30.94x vs fwd 23.67x offers no cushion if EPS estimates get cut (stockanalysis XLY, SSGA). Geopolitics (Middle East) is flagged across the Conference Board survey, Marriott (MAR) Q2 results, and Booking (BKNG) guidance.
FAQ
What is the consumer discretionary sector?
It is the GICS sector covering goods and services people buy when they have spare cash — autos, apparel, restaurants, hotels, entertainment, and e-commerce. The XLY ETF tracks it. AMZN (24.3%) and TSLA (15.9%) alone are over 40% of the fund’s assets (stockanalysis XLY).
Is the consumer discretionary sector a buy or sell right now?
That depends on the name. The sector is down −1.84% YTD while SPY is up +13.9% — but the tape is two-track. Winners (TJX, ABNB, SBUX) are beating; laggards (NKE, MCD, HD/LOW) are fading. The Fed’s hawkish hold removes the rate-cut tailwind for big-ticket names (CNBC).
Which consumer discretionary stocks are holding up best in 2026?
Off-price and travel platforms lead: TJX (Q1 comps +6%, raised guidance), ABNB (beat-and-raise, +18% post-earnings), and SBUX (4th straight comp-growth quarter). These names benefit from a “selective consumer” who trades down on goods but still spends on experiences. See our sectors hub for the full breakdown.
← Back to all posts