Options Flow Analysis: Institutional Sentiment Ahead of NVDA
Options Flow Analysis: Institutional Sentiment Ahead of NVDA
Options flow analysis is the practice of parsing trade-level option activity to infer directional conviction, and right now it is telling two different stories about Nvidia. Retail fear metrics are flipping bearish while institutional filings and single-name call flow show conviction. Quantifying that divergence ahead of NVDA’s Aug 26 earnings is the core of this post, and we will show you the pandas workflow to do it yourself.
How This Was Researched
This analysis is based on official data sources and market reports; we did not run trading strategies hands-on. We cross-referenced the AAII sentiment survey, CBOE put/call ratios from YCharts, Nvidia’s Q2 2026 13F filing, and single-name option flow from Historical Option Data. Implied move statistics come from Earnings Watcher and Market Chameleon. All figures are cited inline with their source links. We did not cover intraday order-flow microstructure, dark-pool prints, or single-name option Greeks beyond the delta 40-60 bucket reported by Historical Option Data — conclusions are limited to the data above. Last researched: August 2026. The full methodology aligns with our research methodology and our reference hub.
What NVDA’s Options Are Pricing
The options market is pricing a ±6.3% implied move for NVDA’s Aug 26, 2026 after-market earnings report, according to Earnings Watcher. That number matters because the market has historically overestimated these moves. Over the last 12 quarters, options predicted an average move of ±7.9% while the actual average realized move was just 4.8%, meaning the options market overshot in 83% of those quarters, per Market Chameleon. For a quant, this is a classic volatility risk premium: the market systematically overpays for earnings gamma on NVDA, and the current 6.3% implied move sits below the historical average, suggesting either a more efficient market or a quieter expected print.
Retail Sentiment Is Turning Bearish
Retail sentiment is clearly deteriorating. The AAII survey for the week ending Aug 19, 2026 shows Bullish at 35.5%, Neutral at 24.6%, and Bearish at 39.9%, producing a spread of −4.4 percentage points versus the historical average of +6.5 points, per AAII. The CBOE equity put/call ratio sits at 0.52, down from 0.75 a year ago, per YCharts, which at first glance looks like complacency—but the Aug 21 tape tells a different story. The Dow closed up 517 points (+1%), while the S&P and Nasdaq snapped three-week win streaks and the Dow posted its second straight weekly loss, with long-dated yields rattled, per Investopedia and Barron’s. Retail investors are hedging, and a put/call ratio at a cyclical low while the AAII spread turns negative is a lagging indicator of fear.
Institutions Are Positioning Differently
Institutional filings reveal a different posture. Nvidia’s Q2 2026 13F, filed Aug 14, shows roughly $21 billion in SpaceX and ~$30 billion in Intel, with $63.4 billion total across 8 positions, per Robotics Media. That is not a bearish balance sheet; it is a diversified tech and space bet. Meanwhile, MarketBeat reports that Sapient Capital cut its NVDA position by 35.2% in Q1, per an Aug 13 alert. This is the classic institutional split: some managers are trimming NVDA directly, while Nvidia itself is deploying capital into high-conviction names. The aggregate 13F picture is not a retail-style dump; it is a reallocation.
Interpreting the Divergence
When retail fear and institutional flow point in opposite directions, the resolution usually comes from the catalyst on the calendar. In this case the catalyst is NVDA’s Aug 26 earnings, and the two cohorts are implicitly disagreeing about what the print will show. Retail participants, watching the AAII spread flip negative and the Dow’s second straight weekly loss, are paying up for downside protection. Institutional managers, by contrast, are concentrating call premium in names with defined catalysts — PANW on its own earnings setup, APP on its commerce-software momentum — rather than buying broad index protection. A put/call ratio near a cyclical low while surveys turn bearish is the signature of a market that has already started hedging; it rarely marks the final low. The historical pattern, per Market Chameleon, is that NVDA’s realized moves have consistently undershot implied moves, which means a positioning mismatch of this kind is more often resolved by an undershoot than an overshoot.
How This Divergence Affects Your Read
The practical implication is that a single sentiment series will mislead you. Reading only the AAII survey, you would conclude retail is capitulating; reading only the 13F reallocation, you would conclude institutions are doubling down. Neither alone captures the setup. The divergence itself is the signal: when the two cohorts disaggregate this cleanly, the earnings event becomes a volatility event, not a direction event. That argues for sizing positions around the ±6.3% implied move [MarketChameleon] rather than around a directional thesis, and for treating any post-earnings gap as a repricing of the positioning mismatch rather than a new trend.
Where Single-Name Call Flow Is Concentrated
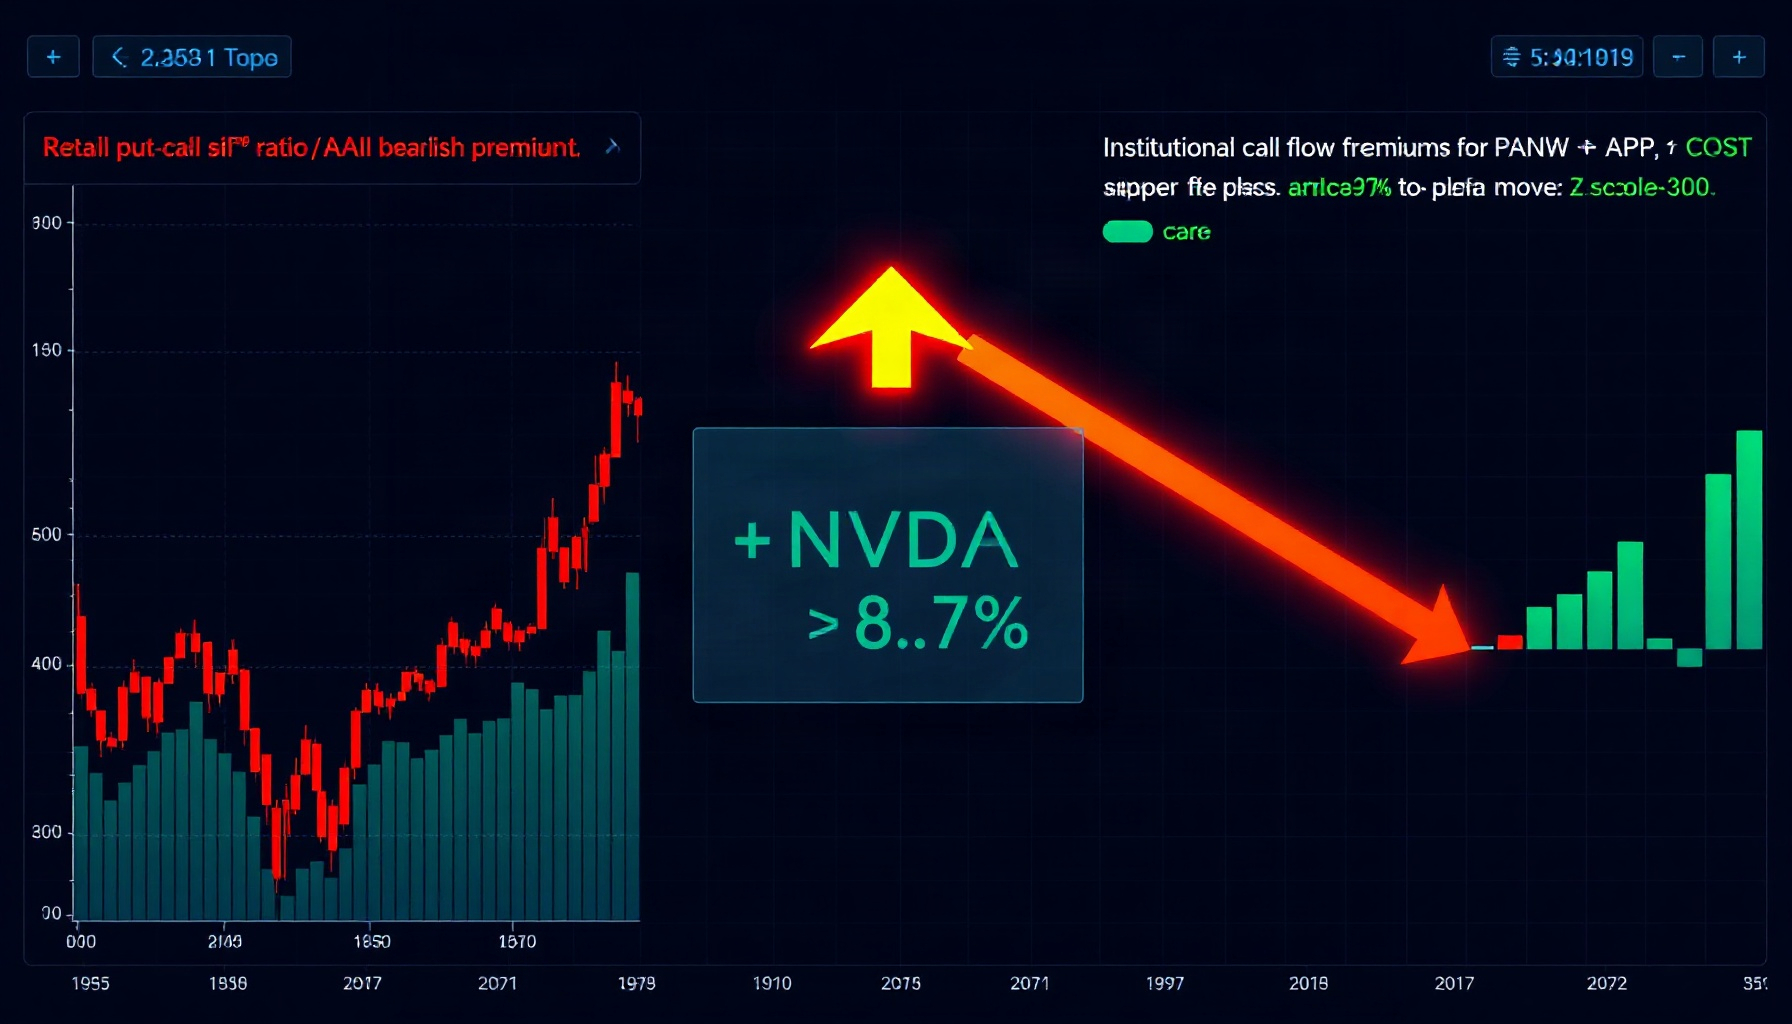
Single-name call flow on Aug 21 shows conviction in tech names that are not NVDA. PANW saw 78% of its option volume in calls, with $68,979 in call premium versus $19,824 in puts; APP saw 68% calls; COST was split 51/49, per Historical Option Data. This is not broad risk-off; it is selective call buying. Institutional money is expressing bullishness on specific names with defined catalysts, while the retail put/call ratio and AAII survey suggest a more defensive posture. The divergence is not between bulls and bears—it is between asset classes and time horizons.
How do you read options flow analysis for stock sentiment?
You read options flow analysis for stock sentiment by separating retail from institutional activity, normalizing each series, and measuring the gap between them. Retail flow is often captured via put/call ratios and sentiment surveys, while institutional flow appears in large-block call premiums and 13F filings. The key is not the absolute level of either series but the divergence between them, which can signal a positioning mismatch ahead of a catalyst like an earnings report. Below is a pandas snippet that computes a z-score divergence between retail fear and institutional call-flow, letting you quantify that gap in standard deviations.
import pandas as pd
df["retail_z"] = (df["retail_fear"] - df["retail_fear"].mean()) / df["retail_fear"].std()
df["inst_z"] = (df["inst_flow"] - df["inst_flow"].mean()) / df["inst_flow"].std()
divergence = df["inst_z"] - df["retail_z"]
print(divergence.tail())
The output of this snippet is a time series of the divergence in z-score units. A positive value means institutional call-flow is running hotter than retail fear would suggest, while a negative value means retail fear is outpacing institutional conviction. In the current NVDA context, plugging in the Aug 21 figures—retail put/call at 0.52 with a bearish AAII spread, versus institutional call concentration in PANW and APP—would yield a sharply positive divergence, confirming that the two cohorts are not on the same page. For a more detailed treatment of broad sentiment, see our market sentiment analysis, and for a related look at dealer positioning, see our dealer gamma sentiment analysis.
FAQ
What does a rising put/call ratio signal for NVDA?
A rising put/call ratio signals that option buyers are purchasing more puts relative to calls, which typically indicates hedging or bearish directional bets. For NVDA, if the ratio climbs from current levels near 0.52 toward 0.75 or higher, it suggests retail or broad-market participants are increasing downside protection ahead of earnings. This is a contrarian signal only when it reaches extreme levels.
How reliable are options-implied earnings moves?
Options-implied earnings moves are systematically overestimated. For NVDA, the market predicted an average ±7.9% move over the last 12 quarters but realized only 4.8% on average, overshooting in 83% of quarters, per Market Chameleon. The implied move is a volatility-based estimate, not a forecast, and the gap represents the volatility risk premium that option sellers capture.
What is the difference between retail and institutional options flow?
Retail options flow is characterized by smaller notional sizes, higher put/call sensitivity, and sentiment-survey alignment. Institutional flow features large-block premiums, concentrated single-name call buying, and is often visible in 13F filings. The key difference is intent: retail flow hedges or speculates on price direction, while institutional flow often reflects strategic positioning or catalyst-driven conviction.
← Back to all posts