Market Sentiment Analysis: The Three-Way Split Ahead of NVDA
Three Records, Three Signals: The August 2026 Sentiment Split
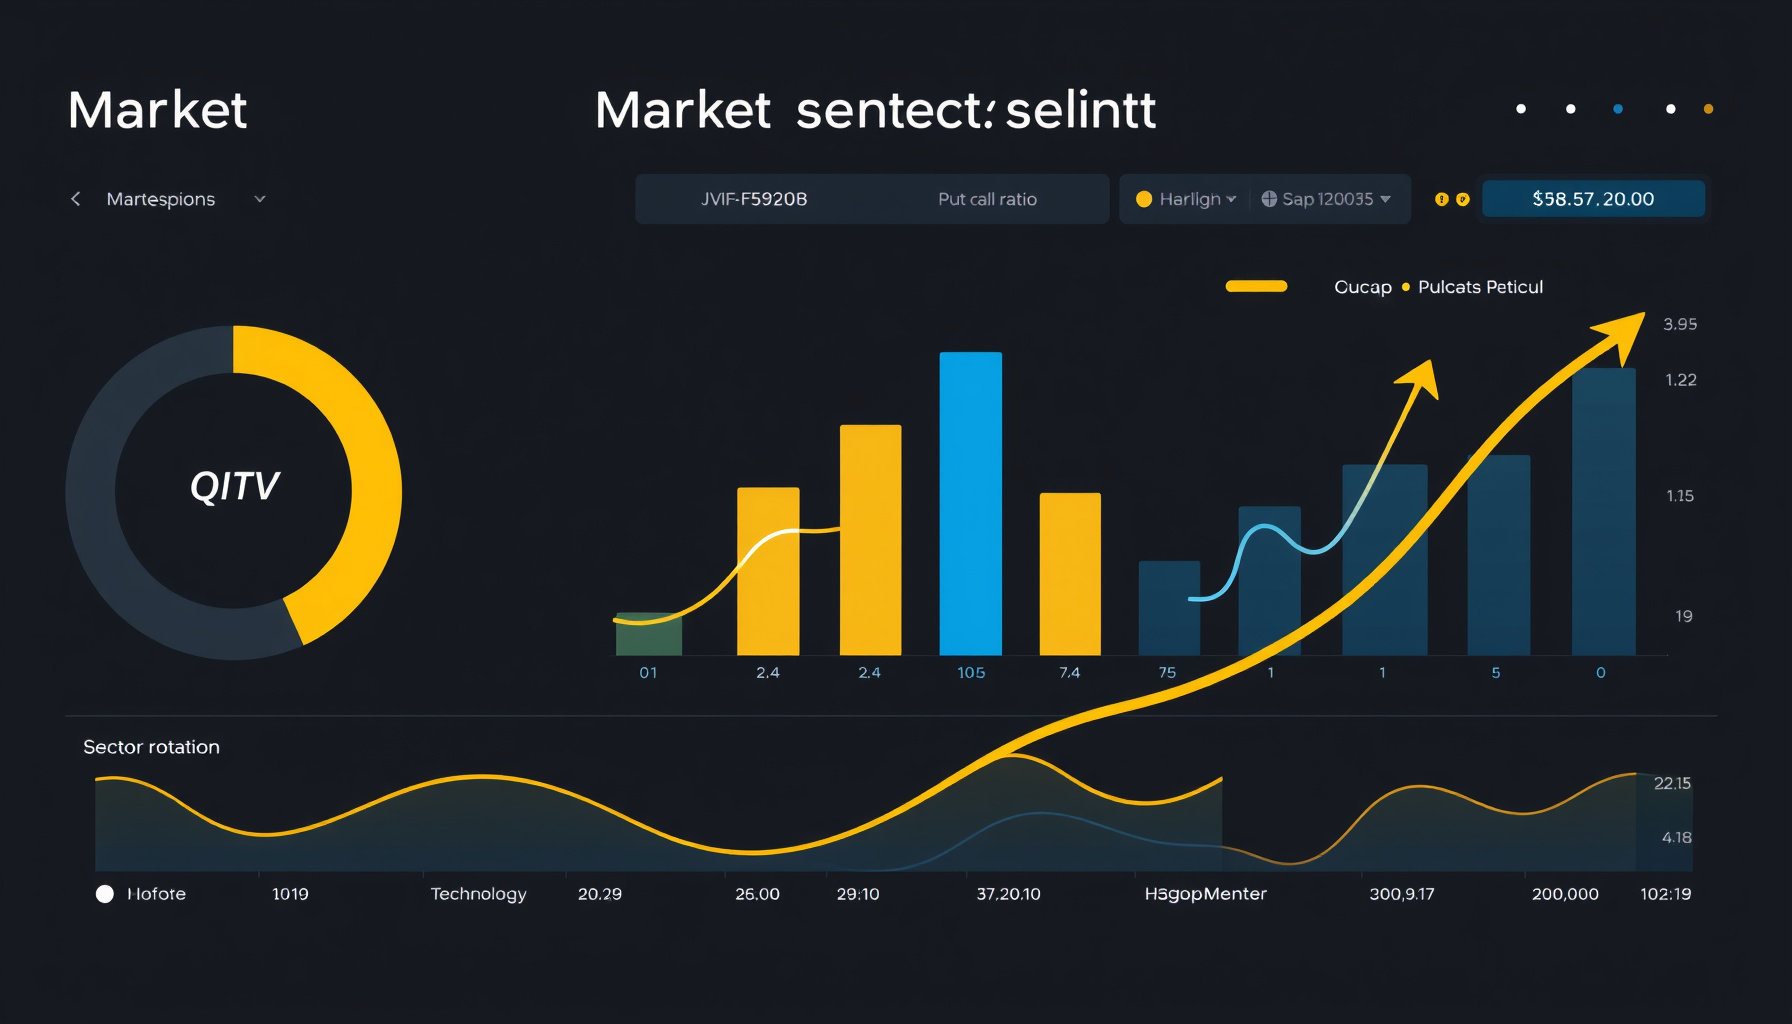
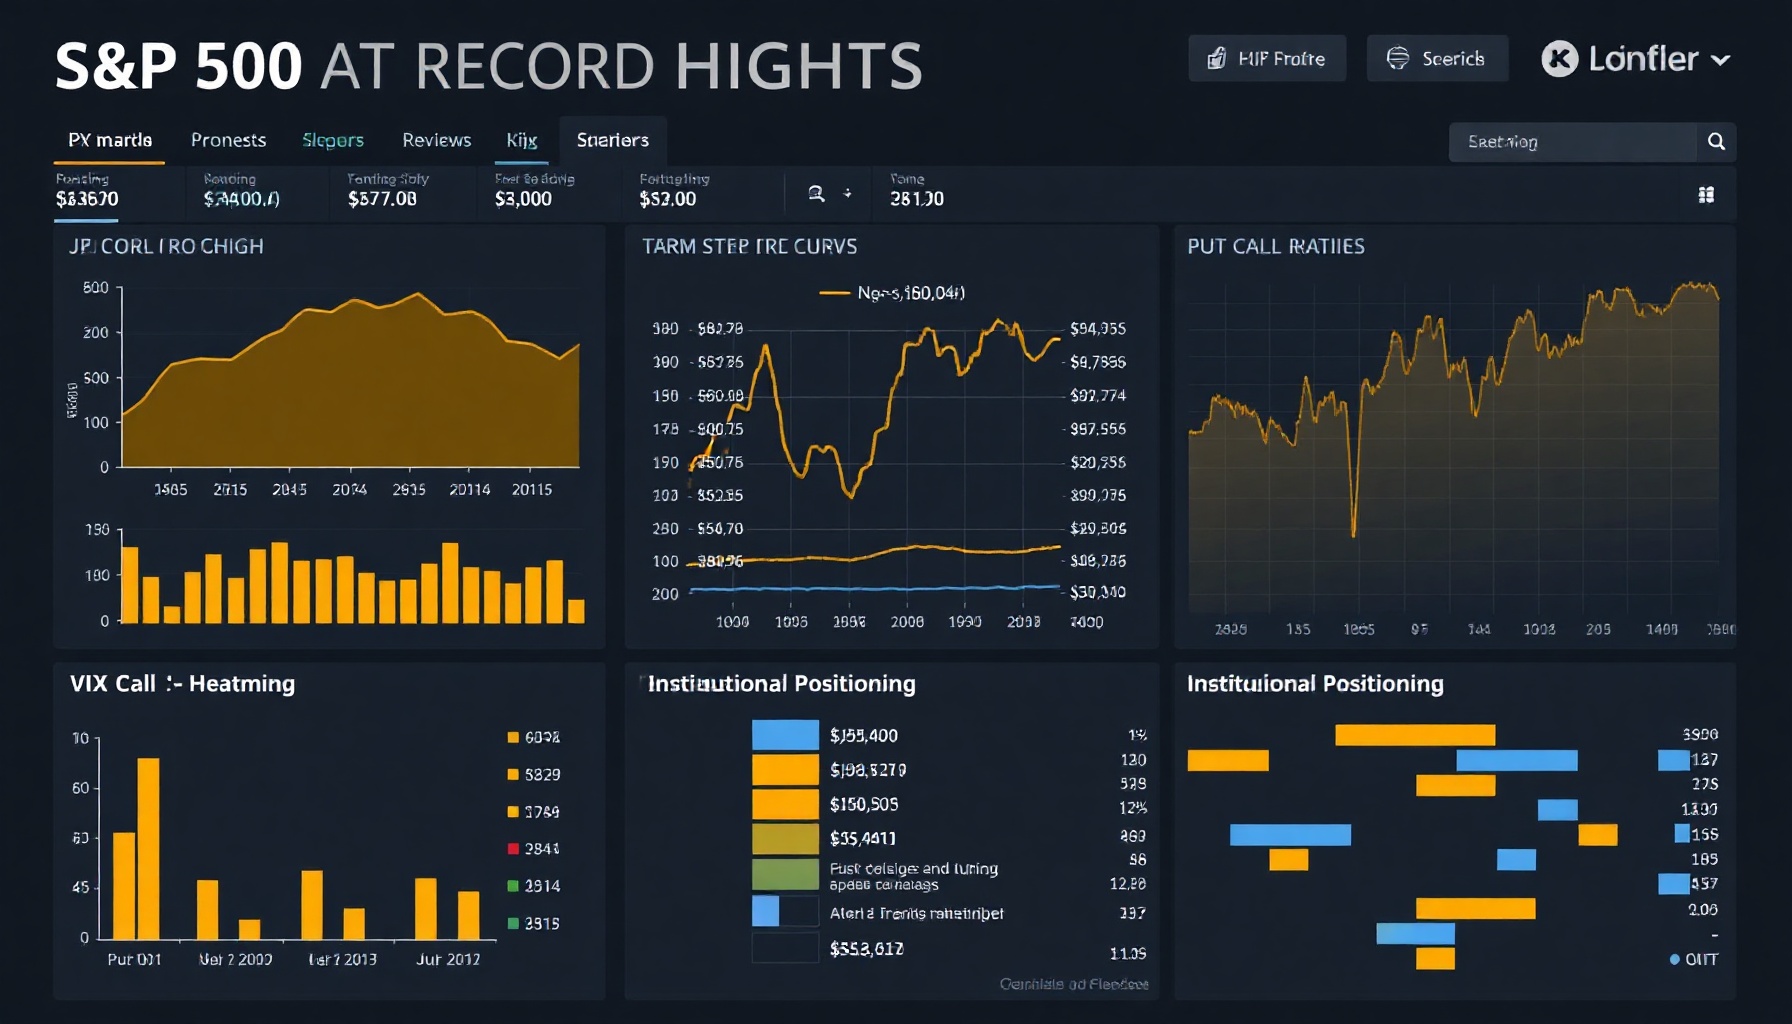
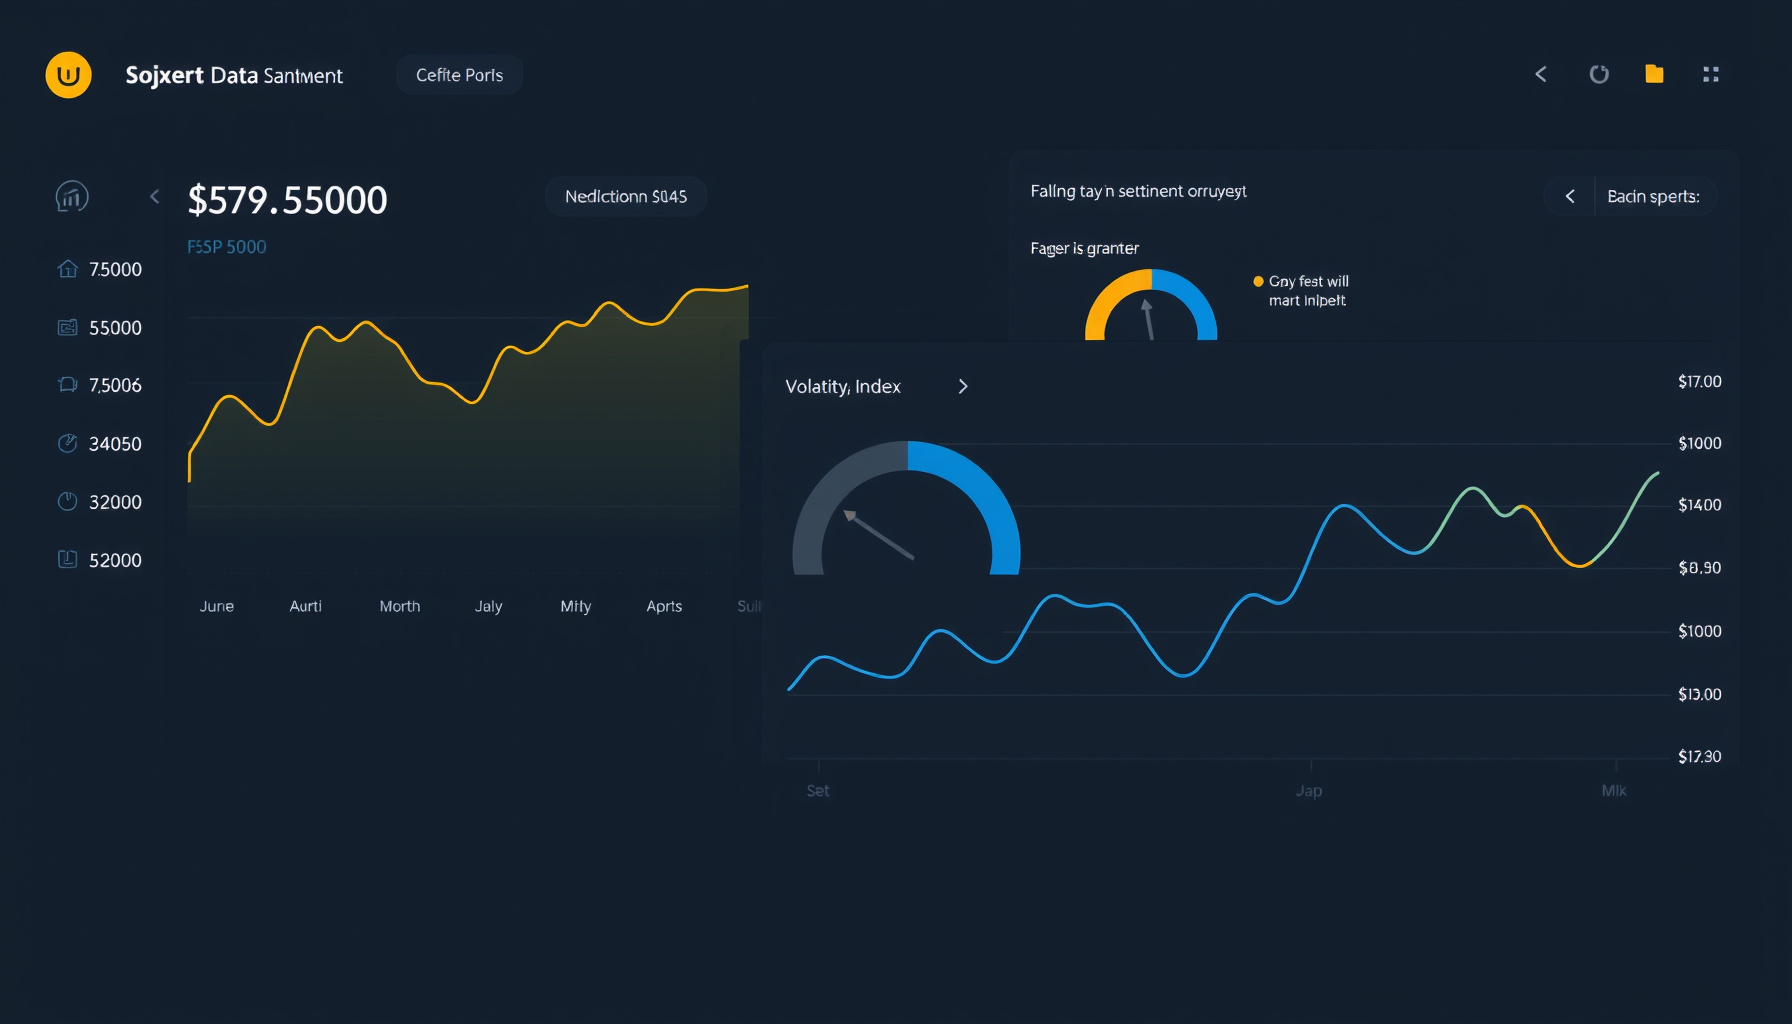
The S&P 500 just hit a record high while a majority of surveyed retail investors expect stocks to fall. The index closed at an all-time high of 7,799 on Thursday, per Yahoo Finance’s market live blog, but the latest AAII survey shows bearish sentiment at 37.9% versus bullish sentiment at just 34.7%, per AAII’s weekly survey report. Meanwhile, the VIX sits at a complacent 14.25, per HistoricalOptionData’s market analysis. This three-way split—record price momentum, skeptical retail sentiment, and calm volatility—defines the pre-NVDA regime. Each data layer tells a different story about risk appetite and positioning heading into a major catalyst. The week’s tape reinforced the momentum layer: the S&P capped a third straight weekly gain while the Dow lagged 0.2% and the Nasdaq-100 slipped 0.1%, per HistoricalOptionData’s market analysis. With July CPI and PPI both cooler than feared, traders stopped pricing a September rate hike, per Investrade’s mid-morning commentary.
How This Was Researched
This analysis synthesizes published indicators from August 13–14, 2026. Data sources include the SEC’s Form 13F data sets, AAII’s official sentiment survey page, exchange and options data, and market reporting via Reuters on Investing.com. Our methodology cross-references price momentum (S&P 500), options-implied volatility (VIX), retail sentiment polls, and institutional 13F filings to identify divergences. We did not analyze intraday order-flow microstructure or dark-pool prints. This analysis is based on official data sources and market reports; we did not run trading strategies hands-on. Last researched: August 2026. See our full research methodology.
What Does Market Sentiment Analysis Actually Tell Us in August 2026?
Market sentiment analysis now reveals a three-layer divergence. Price-based signals show extreme momentum with the S&P 500 at record highs, per Yahoo Finance’s market live blog. Survey-based indicators like the AAII poll show retail investors are net bearish, with 37.9% expecting lower prices, per AAII’s weekly survey report. Institutional flow, as revealed in Q2 13F filings, shows caution toward crowded tech favorites, per Reuters’ 13F analysis via Investing.com. This tripartite split complicates the narrative ahead of NVDA’s August 26 earnings.
Measuring the Split: A Pandas Check on Survey vs. Options Sentiment
The code below computes illustrative z-scores for three key sentiment indicators against conservative baselines to quantify the current dislocation. It demonstrates how a quant can programmatically flag regime divergence.
import pandas as pd

# illustrative baseline parameters — not market data
baselines = {"bull_bear_spread": 10.0, "vix": 18.0, "fear_greed": 50.0}
std_devs = {"bull_bear_spread": 15.0, "vix": 4.0, "fear_greed": 15.0}

# published data as of Aug 14, 2026
current = {"bull_bear_spread": -3.2, "vix": 14.25, "fear_greed": 65}

z_scores = {}
for key in baselines:
    z_scores[key] = (current[key] - baselines[key]) / std_devs[key]

composite_score = sum(z_scores.values()) / len(z_scores)

df = pd.DataFrame({
    "Indicator": ["AAII Bull-Bear Spread (pp)", "VIX", "Fear & Greed Index"],
    "Current": [current["bull_bear_spread"], current["vix"], current["fear_greed"]],
    "Baseline": [baselines["bull_bear_spread"], baselines["vix"], baselines["fear_greed"]],
    "Z-Score": [z_scores["bull_bear_spread"], z_scores["vix"], z_scores["fear_greed"]]
})

print(df)
print(f"\nComposite Dislocation Score: {composite_score:.2f}")
print("(Illustrative analysis of published data — not a tested strategy)")
This illustrative analysis uses published readings—a -3.2pp AAII bull-bear spread, per AAII’s weekly survey report; VIX at 14.25, per HistoricalOptionData’s market analysis; and Fear & Greed at 65, per Finhacker’s Fear & Greed tracker—compared to illustrative baselines. The negative composite score flags a sentiment regime where price optimism and survey skepticism are pulling in opposite directions.
The table quantifies what the narrative describes: the AAII spread sits roughly one standard deviation below its baseline while Fear & Greed sits one standard deviation above its own—survey fear and price greed on opposite sides of neutral. VIX at about -0.9σ confirms hedging is cheap. The composite dislocation score is mild, but the sign split is the signal: options markets are not paying for protection at the same moment retail polls show a bearish plurality. The snippet runs as-is in any environment with pandas installed; swap in fresh readings from AAII’s official sentiment survey page and Cboe’s options market statistics to keep the monitor current.
Where the Flows Are: 13F Caution, Forced Buying, and AI-Infra Call Flow
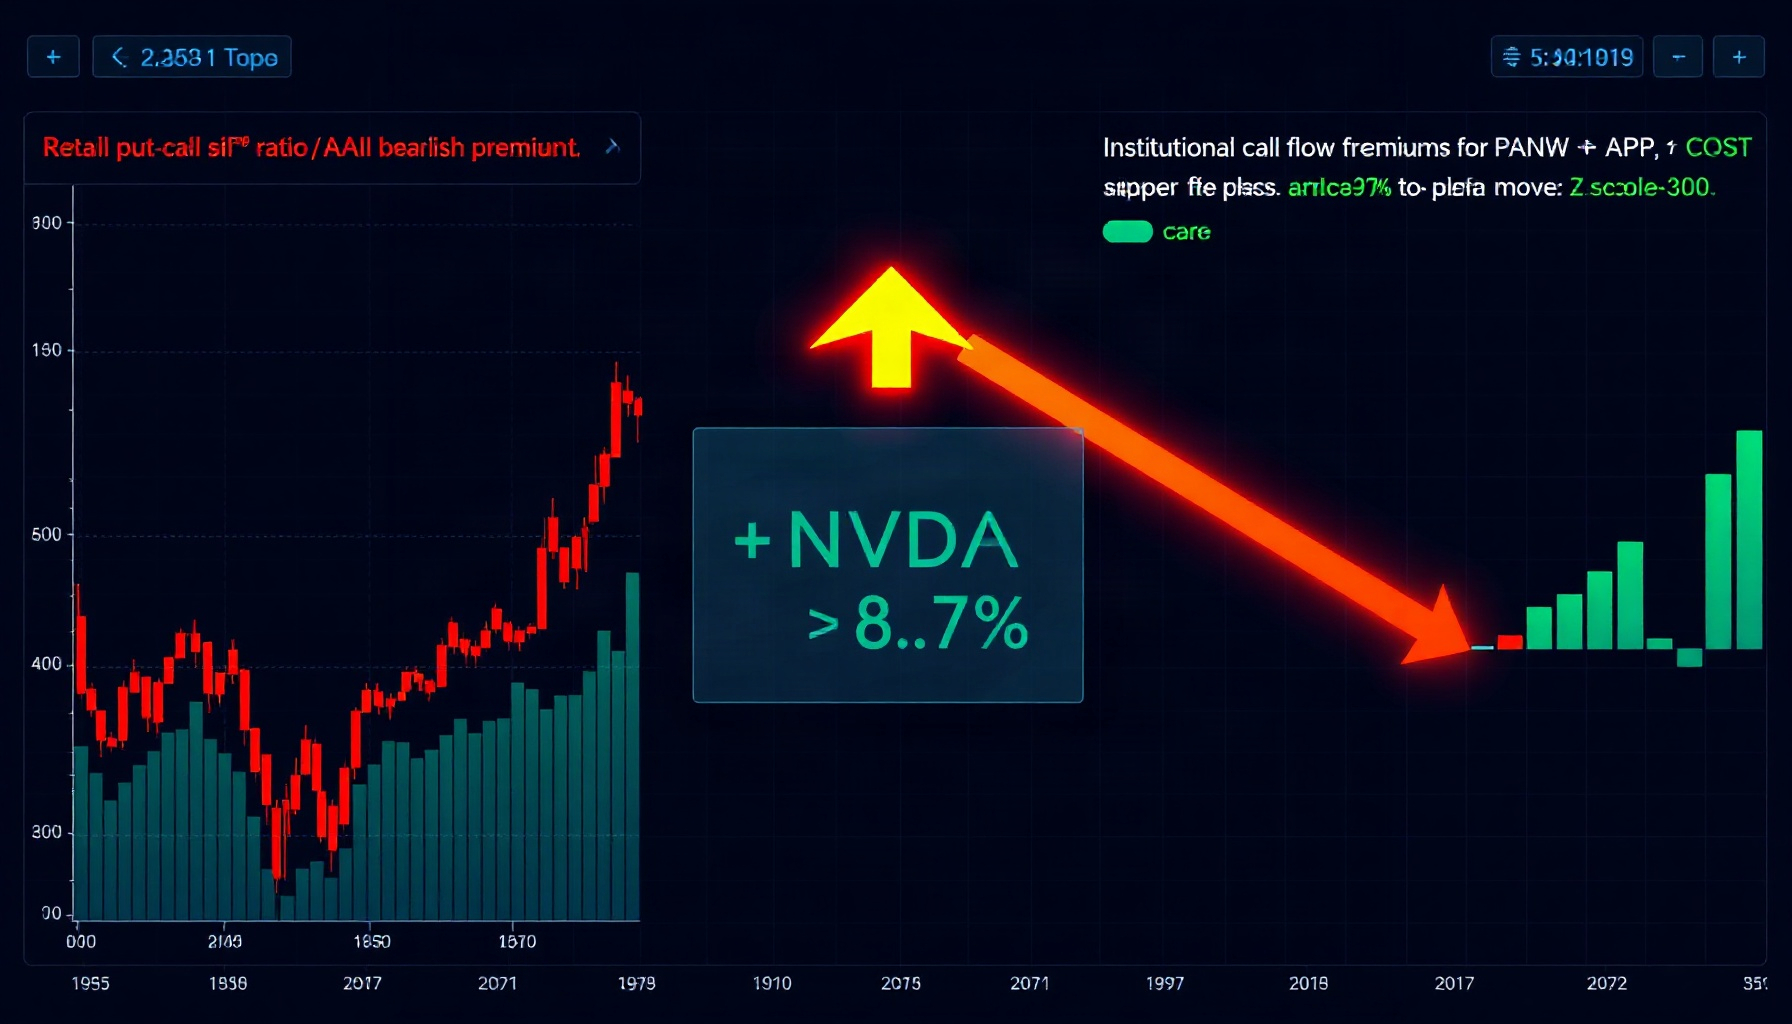
Q2 2026 13F filings, due August 14, show institutions taking a cautious, nuanced stance on tech favorites: Reuters’ analysis of 6,371 filers found 44% trimmed Magnificent Seven holdings while 42% added to them—near-perfect balance that one hedge fund manager called “the absence of consensus,” per Reuters’ 13F analysis via Investing.com. The caution is selective rather than blanket: 48% of filers were net buyers of semiconductor names against 34.5% net sellers, 36% of institutions were net buyers of AI-themed stocks such as CoreWeave and Arista, and energy was the clear exit at 40.3% net sellers versus 28% net buyers, per Reuters’ 13F analysis via Investing.com. The same session showed why flows matter more than fundamentals at the margin: Applied Materials slid roughly 5.5% despite record Q3 revenue of $9.12B, up 25% year over year—a textbook sell-the-news reaction in a crowded long, per EverHint’s market update. This contrasts with mechanical forced buying ahead of S&P 500 inclusion for Reddit (RDDT), expected to rise 11–12% as it replaces AvalonBay on August 18, per EverHint’s market update. Options flow shows a balanced view on Workday (WDAY), with a near-perfect call/put balance amid Silver Lake buyout speculation. Meanwhile, AI-infrastructure call buying is aggressive, with CoreWeave up 19%, Nebius up 28%, and SMCI up 20% on its FY27 guidance of $65–72B, per EverHint’s market update. For deeper flow analysis, see our sector breakdowns and our prior piece on dealer gamma exposure.
Market Sentiment Analysis FAQ
What is the difference between survey-based and price-based sentiment?
Survey-based sentiment, like the AAII poll, per AAII’s official sentiment survey page, captures the forward-looking opinions of retail investors. Price-based sentiment, derived from indicators like the VIX, per HistoricalOptionData’s market analysis, or the S&P 500’s trend, reflects the consensus positioning and risk premium embedded in current market prices.
Why can AAII turn bearish while indexes hit records?
This divergence occurs because survey sentiment is a contrarian indicator and retail investors often react to past price moves or headline risks, per AAII’s official sentiment survey page. Meanwhile, indexes are driven by institutional capital flows and the earnings power of a few large constituents, creating a disconnect between opinion and market mechanics.
How should quant traders weight sentiment before a catalyst like NVDA earnings?
Traders should weight sentiment as a regime filter, not a directional signal. A composite score, as in our code example, can flag whether the market is in a state of complacency (low VIX) or skepticism (bearish AAII survey) before a major event such as NVIDIA’s August 26 earnings, per EverHint’s market update, informing volatility sizing and hedging strategies.
What the August Regime Implies for September Positioning
The August regime is best labeled: complacent options, skeptical retail, cautious institutions. The VIX put/call ratio near 0.43–0.53, per YCharts’ VIX put/call data, confirms options market complacency. NVDA’s August 26 earnings, per EverHint’s market update, will act as a regime-test trigger. A quantitative playbook would size for two-sided outcomes: either a volatility expansion confirming retail caution, or a momentum continuation reinforcing the price trend. The forced-buying from RDDT’s index inclusion echoes mechanical flows that can distort short-term correlations. Set the tripwires in advance: a VIX close above 16.00 would argue for defensive repositioning, while the S&P holding the 7,750 support zone with expanding participation keeps the momentum thesis intact, per HistoricalOptionData’s market analysis. The playbook is conditional, not directional: stay invested while options stay complacent and breadth confirms new highs; trim size and buy hedges if the AAII bull-bear spread widens below -5pp at the same time the VIX breaks 16—two layers agreeing bearish is a regime change, not a positioning quirk. For the systematic version, treat the composite score as one input in a broader regime model alongside breadth and credit spreads; no single sentiment layer is reliable in isolation, per AAII’s official sentiment survey page. Refresh the two primary feeds each week — the AAII weekly survey for retail conviction and Cboe’s daily options statistics for hedging demand — then re-run the composite score whenever either layer moves more than half a standard deviation. For positioning frameworks, review our late-July flow analysis and our research hub.
← Back to all posts