Market Positioning Analysis: Sentiment, Flows, and Hidden Risk
Market positioning and sentiment indicators for August 2026 paint a picture of record-high complacency. The core thesis: complacency is the setup, flows are the fuel, positioning is the tail-risk map. Every soft signal says calm; every hard signal says crowded.
How This Was Researched
Data was collected from primary sources for the week ending Aug 7, 2026. CFTC positions are as of Aug 4 (released Aug 7). Fund flows cover the week ended Jul 29 (ICI report Aug 5). All VIX/SPX/credit reads are daily closes from Aug 1-7. Sources include FRED (SP500, VIXCLS, VXVCLS, BAMLH0A0HYM2, DTWEXBGS), Cboe daily stats and futures settlements, CFTC TFF futures CSV, ICI weekly flow reports, AAII Sentiment Survey, and SEC EDGAR. Not covered: dealer GEX (subscription-only, not fabricated), NYSE breadth (no free primary feed), and DXY uses Fed broad dollar index proxy. Last researched: August 2026.
S&P 500 at Record Highs While VIX Sits at Cycle Lows
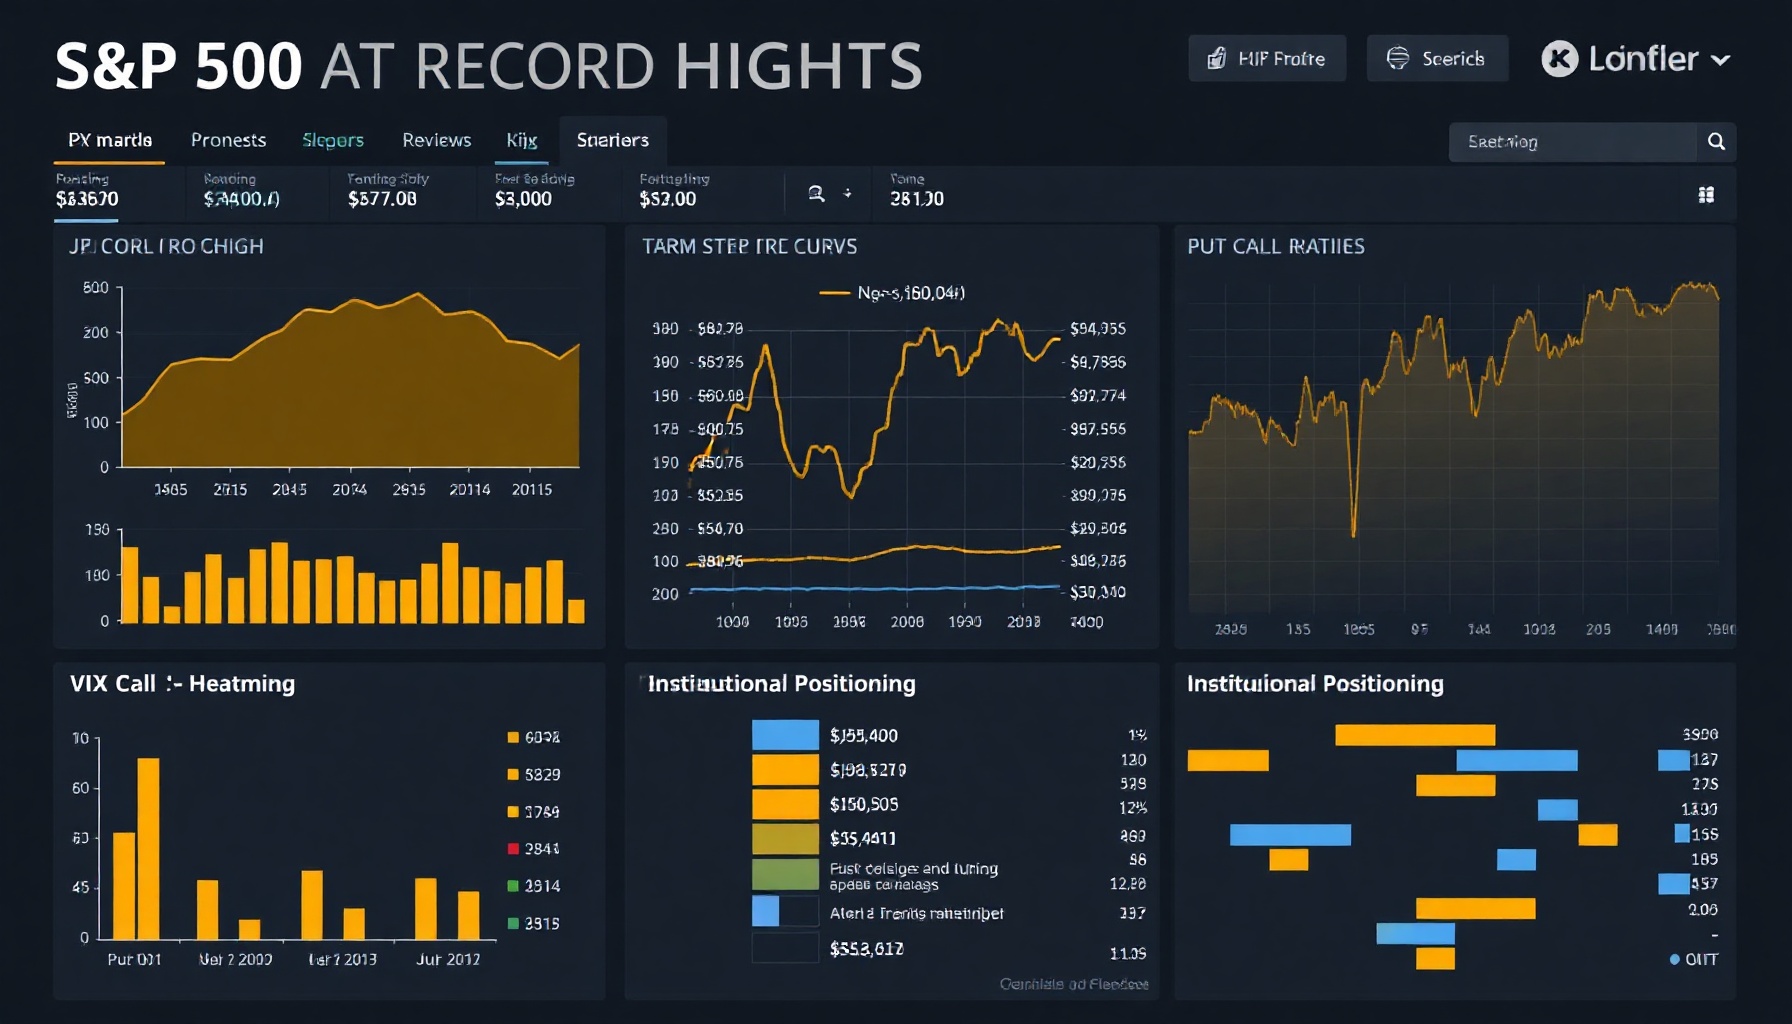
The S&P 500 closed at 7,757.64 on Aug 7, a record high and +2.1% week-over-week, while the VIX closed at 15.15 on Aug 6, per FRED SP500 and FRED VIXCLS. A sub-16 volatility reading at an all-time equity high means the market is pricing in complete calm — the classic setup where tail risk is cheapest to hedge.
VIX Term Structure in Steep Contango
The VIX at 15.15 versus VXV at 18.69 shows a −3.54 vol discount (~19%), per FRED VXVCLS and Cboe futures settlements. The VX futures curve runs Aug 16.99 → Dec 20.61. Watch for VXV−VIX compression below ~2 — that signals rising demand for forward protection and often precedes vol spikes.
How do I read the CFTC Commitment of Traders report for market positioning?
The COT report shows asset managers net long +937k E-mini S&P contracts (~$363B notional), while leveraged funds are net short −330k and dealers are net short −717k, per the CFTC FinFutWk.txt and COT page. On NDX-100, leveraged funds added −23.7k to reach −100k net short. Speculative money is progressively short while asset managers hold record longs — fuel for any sharp reversal.
# Fetch CFTC E-mini S&P positioning from FinFutWk.txt
import pandas as pd

url = "https://www.cftc.gov/dea/newcot/FinFutWk.txt"
df = pd.read_csv(url, sep="\t", low_memory=False)

es = df[df["Market_and_Exchange_Names"].str.contains("E-MINI S&P 500", na=False)]
cols = ["As_of_Date_In_Form_MMDDYYYY",
        "Noncommercial_Positions-Long_All",
        "Noncommercial_Positions-Short_All",
        "Commercial_Positions-Long_All",
        "Commercial_Positions-Short_All"]
print(es[cols].tail(1).to_string(index=False))
For tracking these positioning shifts systematically, see our HMM regime detection methodology to map COT changes to market regime transitions.
Put/Call Ratios and Options Open Interest
Equity put/call ratios for Aug 4-7 were 0.46/0.60/0.57/0.54 — call-heavy — while index P/C ran 0.78/0.94/1.03/0.98 per Cboe Options Daily Stats. SPX put OI is 13.72M vs call OI 10.13M (+35% put premium). This is the classic “retail calls, institutional index puts” split — detect it with our options flow detection methodology.
High-Yield Credit Spreads at Cycle-Tight 2.71%
The ICE BofA US HY OAS tightened to 2.71% on Aug 6, down ~14bp in four sessions, per FRED BAMLH0A0HYM2. IBHY futures are rising (Sep-26 at 183.805 on Aug 7). Credit is pricing zero recession premium, meaning the cheapest tail hedge right now is credit, not equities. A 50bp+ widening from here would be the first actionable risk-off tell.
Equity Fund Flows: The Passive Bid
For the week ended Jul 29, ETF net issuance was +$46.5B (domestic equity +$35.7B) while mutual funds saw −$24.5B, per ICI Combined Flows and ICI ETF Flows. Combined equity flipped to +$17.2B. The passive bid is the marginal buyer — when this flips to redemptions, the feedback loop into index futures is direct. See our prior capital flows analysis for context.
AAII Sentiment: Pessimism Easing, Not Euphoric
The AAII survey for the week ending Aug 5 shows Bull 37.0% / Bear 38.0%, a spread of −1.0pp vs the +6.0pp historical average, recovering from −11.1pp the prior week, per AAII. Retail is not euphoric at record highs — this is a sentiment cushion, not a top signal. Skepticism at highs means the rally still has fuel.
Reading the Signals Together: A Positioning Scorecard
Individual indicators are noisy; the edge comes from how they stack. Running the August 7 data through a simple scorecard shows why the setup is stretched even though no single print looks extreme on its own.
- Equities vs. vol (S&P 7,757 / VIX 15.15): equity at an all-time high with vol in the bottom decile of its range is the most crowded expression of calm the market can produce. This is the “cheapest hedge” regime — options buyers get downside protection at historically low implied vol.
- Term structure (VXV − VIX = −3.54): a steep contango confirms the market is paying almost nothing for forward risk. When this spread compresses toward −2, forward protection becomes relatively more expensive, an early tell that dealers are repricing tail scenarios.
- Positioning (AM net long +937k E-mini, leveraged net short −330k, dealers short −717k): the asymmetry is the key read. Asset managers are the marginal buyer at record length; the leveraged crowd has already flipped short. A reversal needs only a pause in passive inflows to become self-reinforcing, because dealer short gamma forces market makers to sell into weakness.
- Credit (HY OAS 2.71% FRED BAMLH0A0HYM2): spreads at cycle tights mean the bond market is pricing zero recession probability. Credit is the senior signal — when HY starts widening 50bp+ while equities are still near highs, that divergence is the actionable risk-off tell.
- Retail sentiment (AAII spread −1.0pp AAII): the one cushion. Retail skepticism at record highs is unusual; it suggests the rally is not yet a mania, and it gives bulls a contrarian tailwind.
When four of five pillars say crowded and only sentiment says cautious, the rational play is not to short the tape but to size hedges while they are cheap — put spreads on index futures and long HY protection cost roughly what they did at the start of the year.
Three Scenarios for the Next 30 Days
Base case: grind higher, vol stays low. Passive flows (+$17.2B combined equity, per ICI Combined Flows) keep the bid under the market, 13F Q2 filings confirm institutional ownership of AI-capex names, and VIX drifts in the 13-16 range. Strategy: stay long trend, keep hedge rolling at current low cost, watch the VXV−VIX spread for the first sign of term-structure flattening.
Risk case: HY-led repricing. A 50bp+ widening in HY OAS — triggered by a credit event or a hawkish data surprise — forces dealers to de-hedge short positions. With leveraged funds already short on NDX-100, the covering squeeze could be violent in both directions. Strategy: this is where the cheap index puts pay off; expect drawdowns of a few percent to be bought quickly given asset-manager cash reserves.
Tail case: positioning unwind. If equity fund flows flip to redemptions (−$24.5B mutual fund outflows accelerate and ETF issuance reverses, per ICI Combined Flows), the feedback loop into index futures is direct: asset managers delever into falling prices, dealers with short gamma sell more, and vol spikes break the contango. Strategy: hold long-dated (Dec) VX futures protection, not just 30-day puts — the term structure says Dec 20.61 is still cheap relative to what a cascade would price.
None of these scenarios require a fundamental bearish call. They are risk-management branches off a single thesis: complacency is the setup, flows are the fuel, positioning is the tail-risk map.
13F Q2 2026 Season: The Deluge Comes Next Week
The 13F deadline is Aug 14, and as of Aug 7 only small RIAs have filed, per SEC EDGAR. Build or refresh your EDGAR XML parser now — the Q2 filings will show whether institutions added to AI-capex names after SpaceX earnings. For positioning context, see our dealer gamma sentiment analysis.
FAQ
What does the VIX-VXV spread tell me about market positioning?
The VIX-VXV spread measures the slope of the volatility term structure. At −3.54 vols, the market expects calm to persist, per FRED VXVCLS. When this spread compresses below −2, it signals rising demand for forward protection — a leading indicator for dealer positioning shifts.
How often is the CFTC Commitment of Traders report published?
The CFTC publishes the COT report every Friday at 3:30 PM ET, covering positions as of the prior Tuesday, per the CFTC COT page. The TFF (Traders in Financial Futures) CSV is released the same day — pull FinFutWk.txt directly for machine-readable data.
Are high-yield bond spreads a reliable recession indicator?
High-yield spreads are a reliable stress indicator, not a timing tool. At 2.71%, credit is pricing zero recession risk, per FRED BAMLH0A0HYM2. Spreads below 3% historically precede drawdowns by 6-12 months — combine with positioning data for confirmation.
← Back to all posts