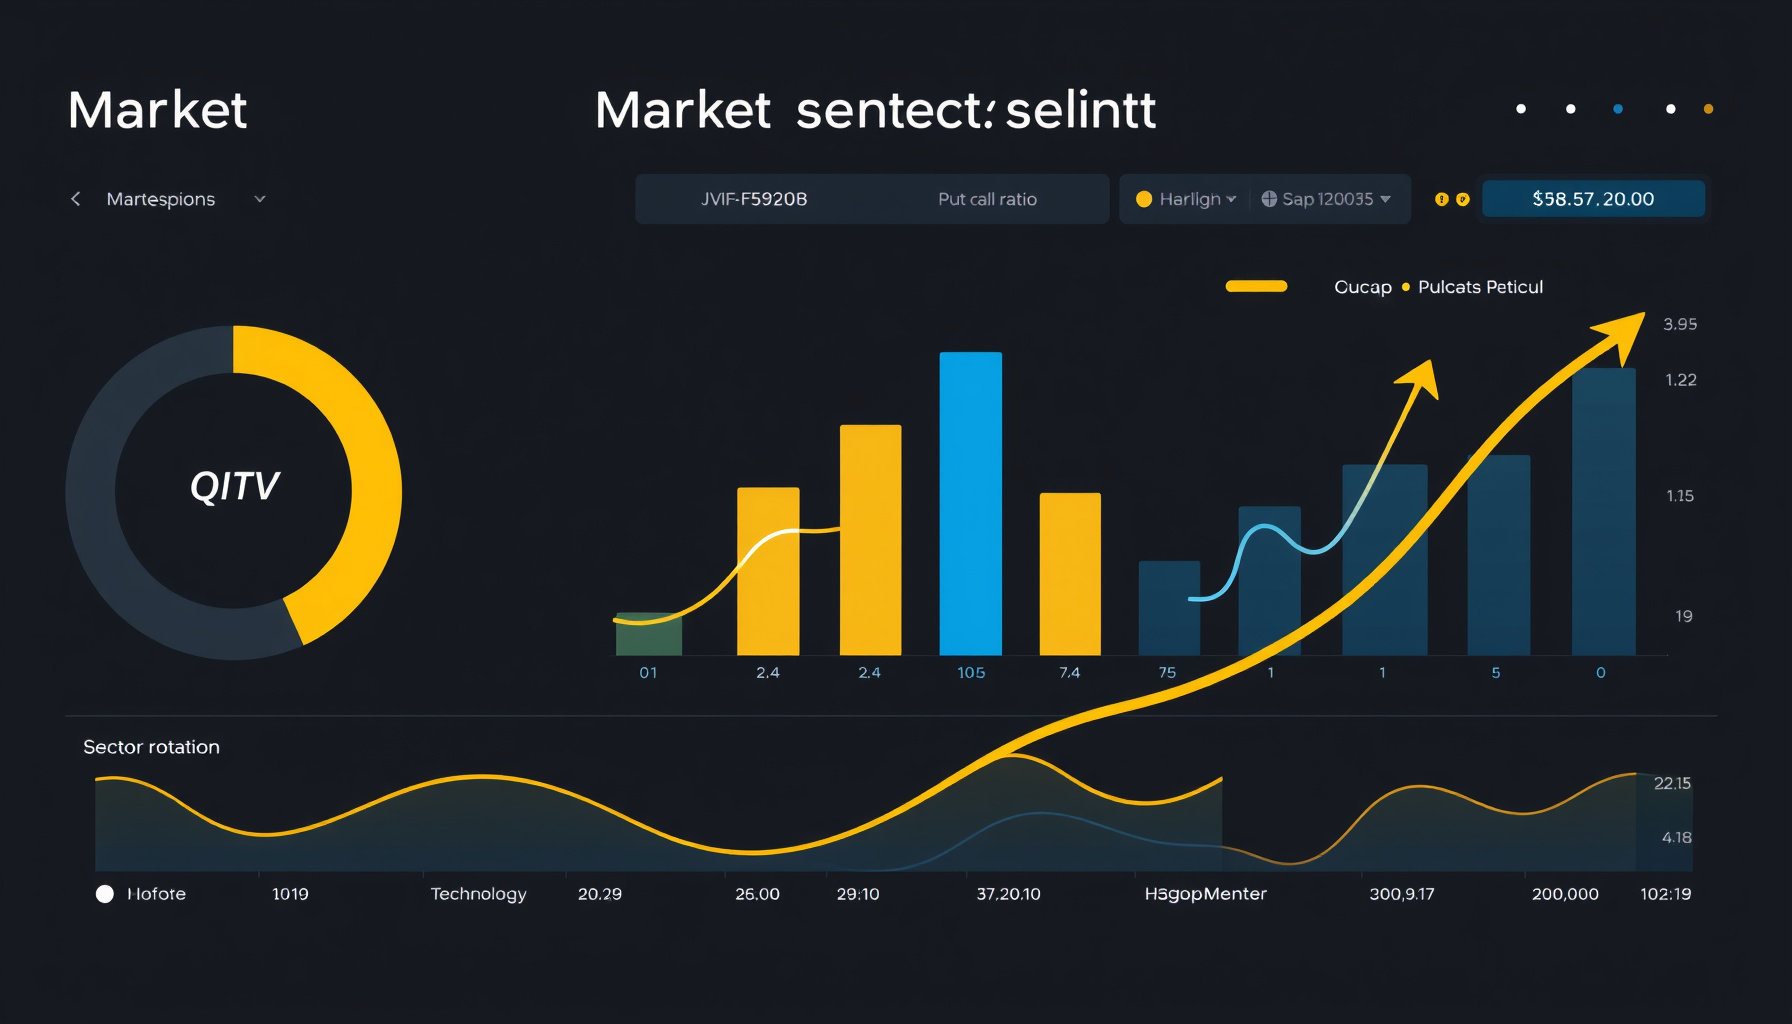
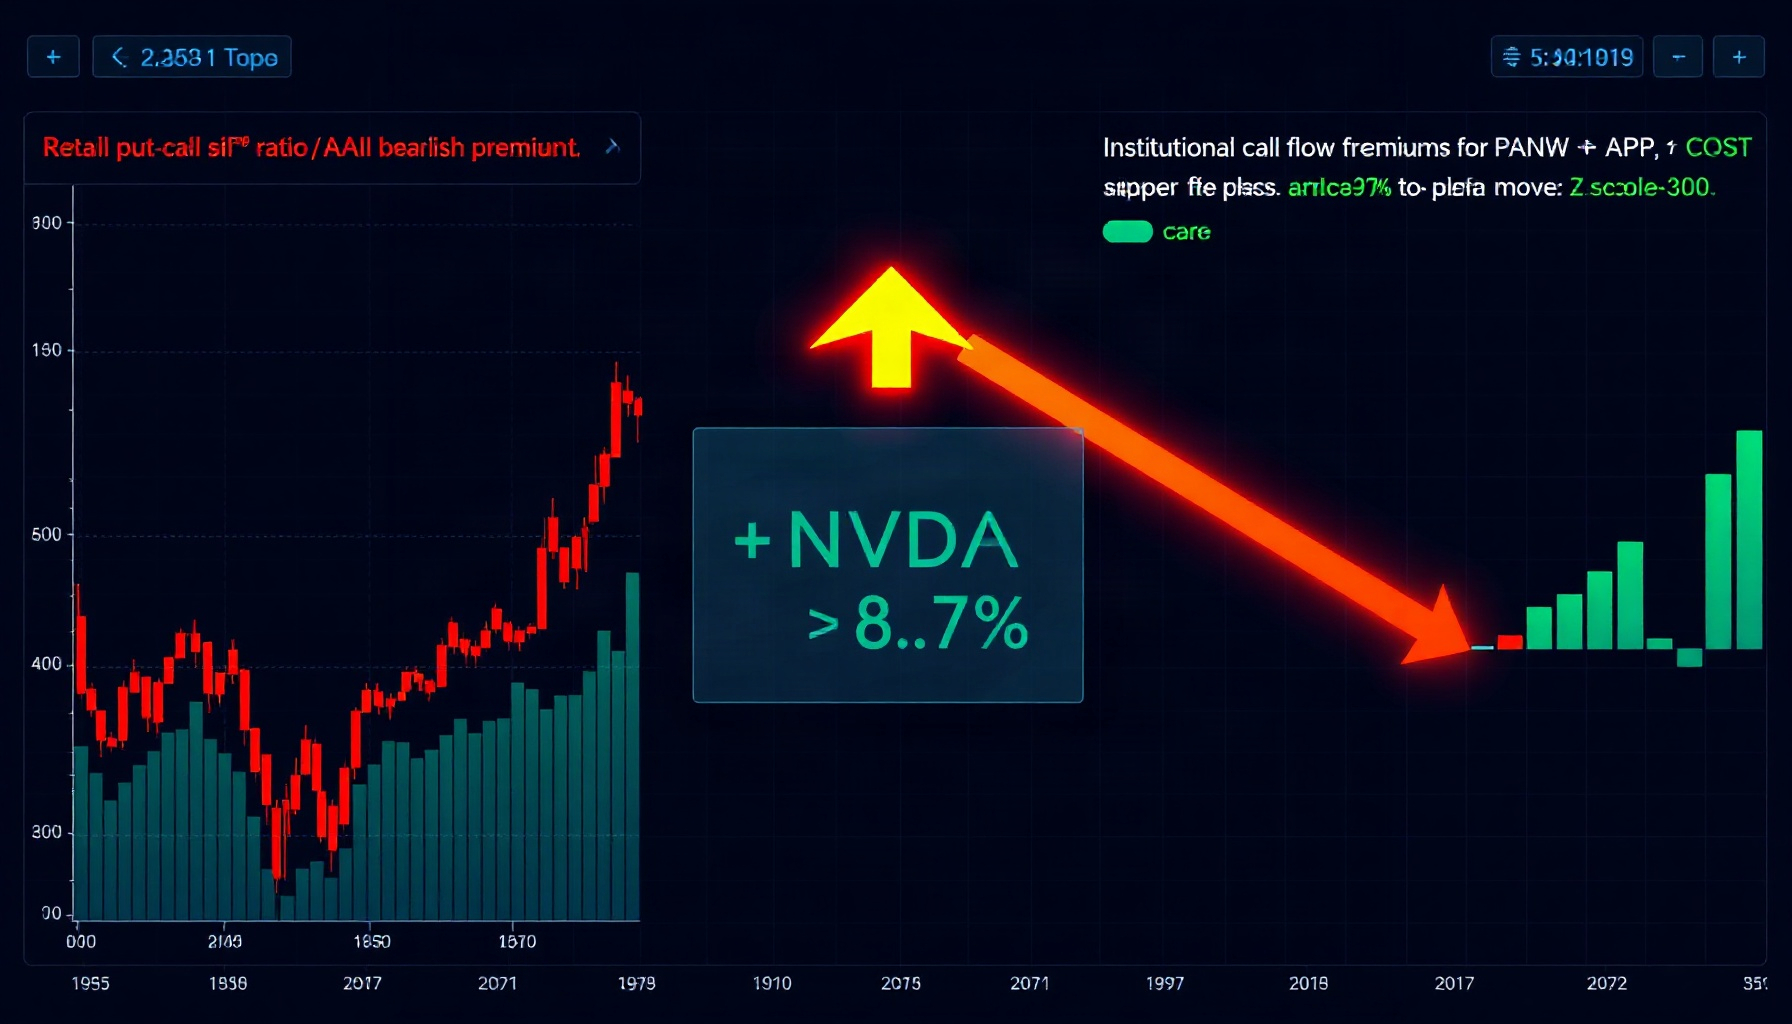
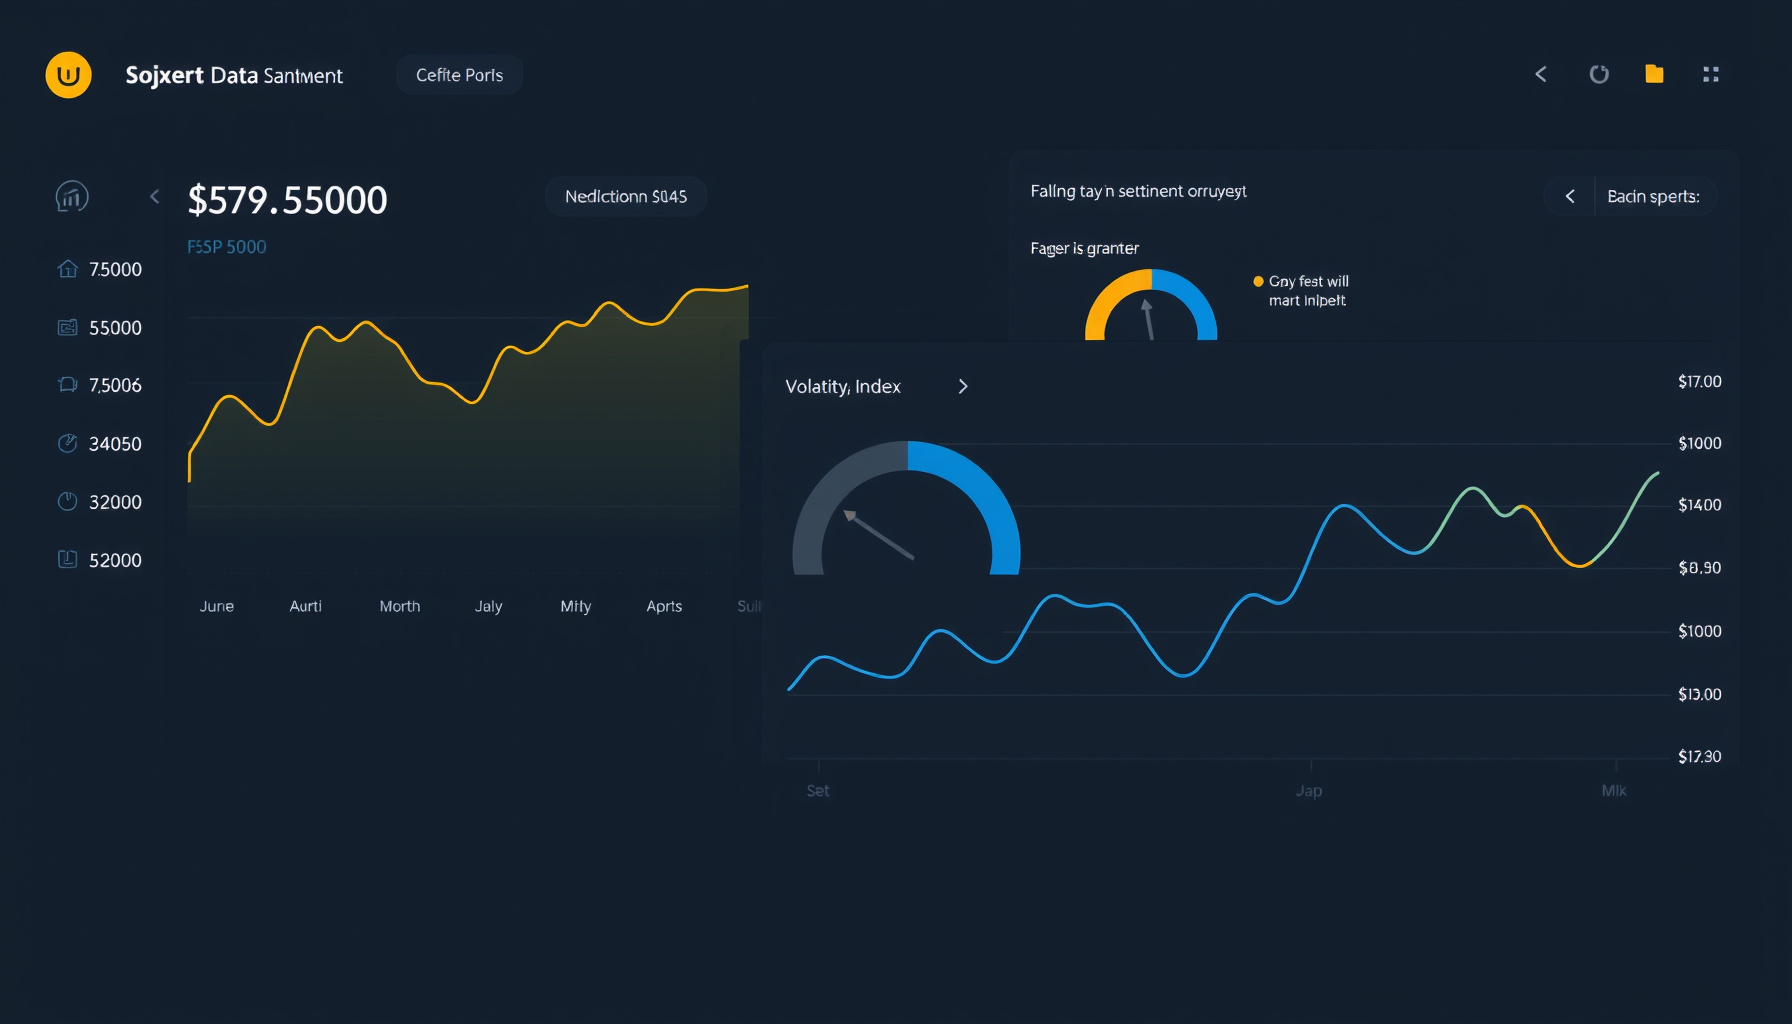
October 2026 Sentiment & Flow: The Put/Call Divergence Into Q3 Earnings
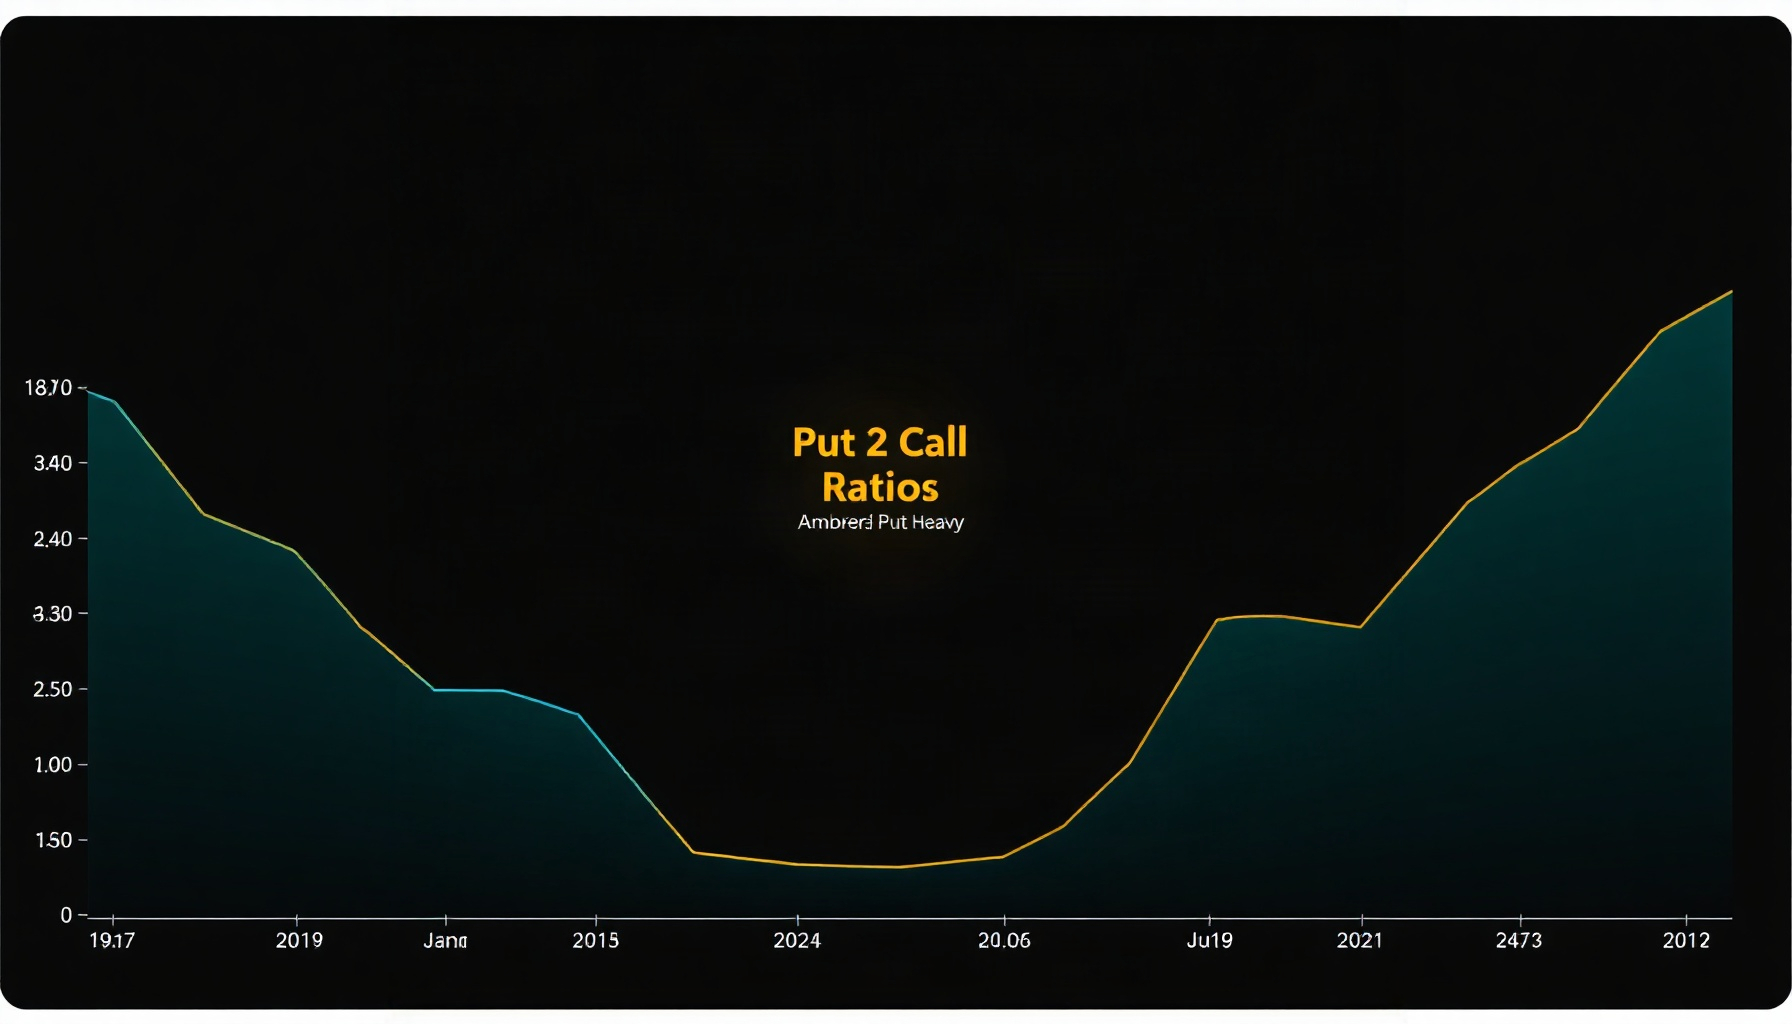
October 2026 Sentiment & Flow: The Put/Call Divergence Into Q3 Earnings
The Setup: One Tape, Two Sentiments
The equity and index option tapes are telling different stories about the same week. Single-stock traders are buying calls, index traders are buying protection, and the S&P 500 just printed a record close. The divergence matters most because it sits right before the bank earnings cluster and a CPI print.
Equity options are leaning bullish while index options are leaning defensive. Here is the thesis in one sentence:
Equity-only option positioning is call-skewed and complacent (CBOE equity P/C ≈0.61 vs its ≈0.60 historical average) while index-option positioning is put-heavy and hedged (index P/C ≈1.21), and that divergence into Q3 earnings — with US equity funds logging their first weekly outflow in three weeks and long-term equity mutual funds at −$37.13B for the week ended 2026-09-30 — marks a market where hedgers and speculators disagree about the same event.
Read that as a measurement, not a forecast. Index put/call ratios run structurally higher than single-stock ratios because institutions routinely buy index puts to hedge whole portfolios. The useful question is whether the gap is larger than usual, and whether the flow data agrees with the options data.
How This Was Researched
This post is desk research built only from published data: CBOE market statistics, AAII and ICI weekly releases, and Reuters reporting. Each figure links to its source on the line where it appears, and each carries a date so you can see how stale it is.
CBOE put/call ratios are 2026-10-09 intraday readings through 11:30 AM CT and will drift by the close. AAII and ICI figures are weekly and one week stale by construction.
Desk research on official CBOE, AAII, ICI and Reuters data; no strategy was run, no account traded, no live feed subscribed; the pandas snippet illustrates the method, not a backtest.
The Divergence in Numbers: Equity P/C ≈0.61 vs Index P/C ≈1.21
Equity-only put/call sits near 0.61, close to its historical average of about 0.60, while index put/call sits near 1.21. The gap is roughly two to one, and that spread is the core of this post. Read it as a structural difference in who is buying protection, not as a call on direction.
The CBOE Market Statistics page shows the 2026-10-09 intraday ranges: TOTAL P/C 0.78 to 0.84 (about 0.80), INDEX P/C 1.18 to 1.24 (about 1.21), and EQUITY single-stock P/C 0.59 to 0.67 (about 0.61). Because index ratios are structurally higher, the roughly 2x gap alone says little. The comparison that carries information is equity against its own history, which is 0.61 against about 0.60 — Market Indicators lists the equity-only historical average at about 0.60.
Price action was constructive. Market Indicators shows SPY at 778.26 (+0.56%), QQQ at 750.76 (+0.43%), DIA at 515.49 (+0.75%), and IWM at 278.99 (+0.51%), with GLD up 1.49% and TLT at 77.93. The S&P 500 set a record close on 2026-10-06. Hedgers are paying for protection while single-stock speculators lean long — two cohorts, one buying event, opposite postures.
The Signal Table: Five Reads, One Week
Five readings, each dated, point in slightly different directions. Taken together they describe positioning that is call-tilted in single stocks, hedged in indexes, and only beginning to warm up in retail sentiment. No single row is decisive on its own, and the table is a reading list rather than a ranking.
| Signal | Reading (as of) | Interpretation |
|---|---|---|
| CBOE equity-only P/C | ≈0.61 (10-09 intraday; hist. avg ≈0.60) per CBOE Market Statistics | Call-skewed, complacent single-stock positioning |
| CBOE index P/C | ≈1.21 (10-09 intraday) per CBOE Market Statistics | Put-heavy, hedged index positioning |
| AAII bull-bear spread | +1.3 (week ended 10-07; prior −11.8; avg +6.5) per AAII past results | Retail optimism just peeking out, still below average |
| VIX | 15.08 close 10-07 (range 15.01–17.71 since 09-16) per StockDoz | Low, drifting down post-FOMC |
| ICI equity mutual fund flows | −$37.13B (week ended 09-30) per ICI flows; Reuters reports US equity funds’ first weekly outflow in three weeks (week ended 10-07) | Mutual-fund equity outflow, near-offset once ETFs are counted |
AAII: Retail Optimism Peeks Out of an 11-Week Hole
The AAII bull-bear spread turned positive to +1.3 for the week ended 2026-10-07, the first positive reading in 11 weeks. Sentiment is improving from a pessimistic base, but it remains below the +6.5 long-run average. That is a change in direction, not yet a change in regime.
For the week ended 2026-10-07, bullish came in at 40.3% (+5.6), neutral at 20.8% (+1.9), and bearish at 39.0% (−7.5), per AAII past results and AAII commentary. The prior week, ending 2026-09-30, had bullish at 34.6%, neutral at 18.9%, and bearish at 46.5%, a published spread of −11.8, per Seeking Alpha’s AAII survey write-up. Historical averages are bullish 37.5%, neutral 31.0%, and bearish 31.5%.
As of 10-02, neutral had sat below average for 30 straight weeks and bearish above average for 34 straight weeks. The move so far is bearish sentiment unwinding, not a broad rush into bulls. The same AAII special question on midterms (10-02) produced 32.1% saying no meaningful impact, 28.2% saying it depends on Congress, 17.6% bullish, 15.3% bearish, and 6.9% unsure.
Flows: The −$37.13B Equity Outflow and What ETFs Absorbed
Long-term equity mutual funds lost $37.13B in the week ended 2026-09-30, a sizeable outflow, but combined mutual fund and ETF net issuance was only −$1.97B. ETF issuance nearly offset the mutual fund exit, which suggests a change in vehicle more than a change in conviction.
ICI’s flow data shows long-term mutual funds at −$55.345B for the week ended 2026-09-30. Equity was −$37.13B (domestic −$31.556B, world −$5.574B), hybrid −$1.162B, and bond −$17.053B (taxable −$10.379B, muni −$6.674B). Prior weekly totals ran 9/23 −$19.709B, 9/16 −$36.716B, 9/9 −$9.767B, and 9/2 −$25.104B — so the mutual-fund equity series had been running negative for weeks, not flipping in one print.
Once ETFs are included, the picture is far less dramatic. ICI’s combined flows show long-term mutual fund plus ETF net issuance at −$1.97B for that week. Reuters reported that US equity funds saw their first weekly outflow in three weeks in the week ended 2026-10-07, after two weeks of inflows, on profit-taking during a rally. A flow reversal of this size, read alongside the options data, points to repositioning rather than a clean exit.
The Calendar Risk Stack
The next four weeks stack earnings, inflation, a policy meeting, and an election into one window. Bank earnings and September CPI share a morning, and the calendar, not any single print, is the main event risk to watch. That stacking is what makes the next two weeks hard to read from options alone.
- Season open: PepsiCo reported 10-08 and Delta 10-09, per season dates.
- Banks: JPM, WFC, C, and GS report Tuesday 10-13 pre-market. BAC and MS report Wednesday 10-14, the same morning as September CPI, per bank earnings playbook and season dates.
- Options expiration: OPEX falls on 10-16.
- FOMC: 10-27 and 10-28.
- Midterms: 11-03.
- Rates backdrop: XLF is down about 4% since the Sep-16 Fed hike while the S&P 500 rose more than 3%, with the 10-year yield above 5%, per banks under pressure from spiking yields.
- Consensus: FactSet consensus, as summarized in season dates, calls for S&P 500 Q3 earnings growth of +29.1% and revenue growth of +12.1%.
Measure It Yourself: A z-Score Divergence Workflow in pandas
A rolling z-score puts equity P/C, index P/C, and the AAII spread on a common scale so you can see when their gap is unusual relative to its own recent history. The snippet below is a measurement you can rerun each week, and the window choice is the main judgment call.
import pandas as pd

# Illustrative only: weekly CSV with columns date, equity_pc, index_pc, aaii_spread.
# The 52-week rolling window is an illustrative choice. This is a measurement,
# not a strategy test or signal generator.
df = pd.read_csv("sentiment_weekly.csv", parse_dates=["date"], index_col="date").sort_index()

def rolling_z(s: pd.Series, window: int = 52) -> pd.Series:
    mu = s.rolling(window, min_periods=26).mean()
    sd = s.rolling(window, min_periods=26).std()
    return (s - mu) / sd

z = df[["equity_pc", "index_pc", "aaii_spread"]].apply(rolling_z)
z["divergence"] = z["equity_pc"] - z["index_pc"]
print(z.tail(1).round(2))
A negative divergence means equity P/C is unusually low relative to index P/C over the trailing year, which is the pattern this post describes. Feed it the CBOE, AAII, and ICI series you collect yourself, and check that the dates align before you trust any single print.
FAQ
Why is index put/call always higher than equity put/call?
Index options attract institutional hedging, so puts are bought more often relative to calls. The CBOE Market Statistics page shows index P/C near 1.21 against equity P/C near 0.61 on 2026-10-09, which is why the level alone tells you little.
Does the divergence predict the market?
No. The divergence describes how positioning is split across hedgers and speculators heading into the same event. It does not give direction or timing, and the same reading can precede a rally or a drawdown.
Which of these inputs goes stale fastest?
The CBOE ratios. They are intraday readings through 11:30 AM CT on 2026-10-09 and will drift by the close. AAII and ICI data are weekly and one week behind by construction.
Bottom Line: What the Divergence Does and Does Not Tell You
The divergence tells you that hedgers and speculators are positioned differently into the same earnings window. It does not tell you direction, timing, or whether either side is right, and the roughly 2x equity-versus-index gap is largely structural. Treat it as a reason to read the calendar carefully, not as a trade.
Watch three things over the next few weeks: whether the CBOE ratios hold their intraday readings at the close, whether the AAII spread stays positive after its first positive week in 11, and how the bank prints on 10-13 and 10-14 land against the CPI release. Each one can confirm or weaken the read without requiring any view on where the index goes next.
← Back to all posts