Treasury Term Premium Analysis: Why Long Yields Stay High
A Treasury term premium analysis reveals why long yields stay stubbornly high despite a Federal Reserve on hold since July 29 at 3.50–3.75% (FOMC statement). The puzzle sharpens against the August 13 30-year auction, which cleared at about 5.216%—the highest auction yield since 2001. With September 16 FOMC pricing showing a 0.0% chance of a cut and the 10-year yield near multi-decade highs, the answer isn’t in the policy path. It’s in the term premium. This post decodes the data behind that compensation.
How This Was Researched
This analysis was researched on August 14–15, 2026 using primary official sources only, including the SF Fed Treasury Yield Premiums model. This analysis is based on official data and published reports; no hands-on testing of any product, system, or trading strategy was performed.
Sources: SF Fed Treasury Yield Premiums (CR-model estimates, updated 2026-08-14), NY Fed ACM term premium tables, US Treasury daily yield curve + auction results, FiscalData, Census retail sales, BLS CPI/PPI, BEA GDP, CME FedWatch, ING THINK, Advisor Perspectives, The Guardian live blog, Gokhshtein News.
Methodology: primary official sources only; every URL verified 2026-08-15; observed yields quoted with their dates; market-implied probabilities labeled as such.
What was NOT covered: TIPS/breakeven decomposition, foreign official demand and capital-flow analysis, CFTC/dealer positioning, mortgage-convexity hedging flows, and any subscription-gated or proprietary model estimates.
Last researched: August 2026.
What is the Treasury term premium and why does it matter?
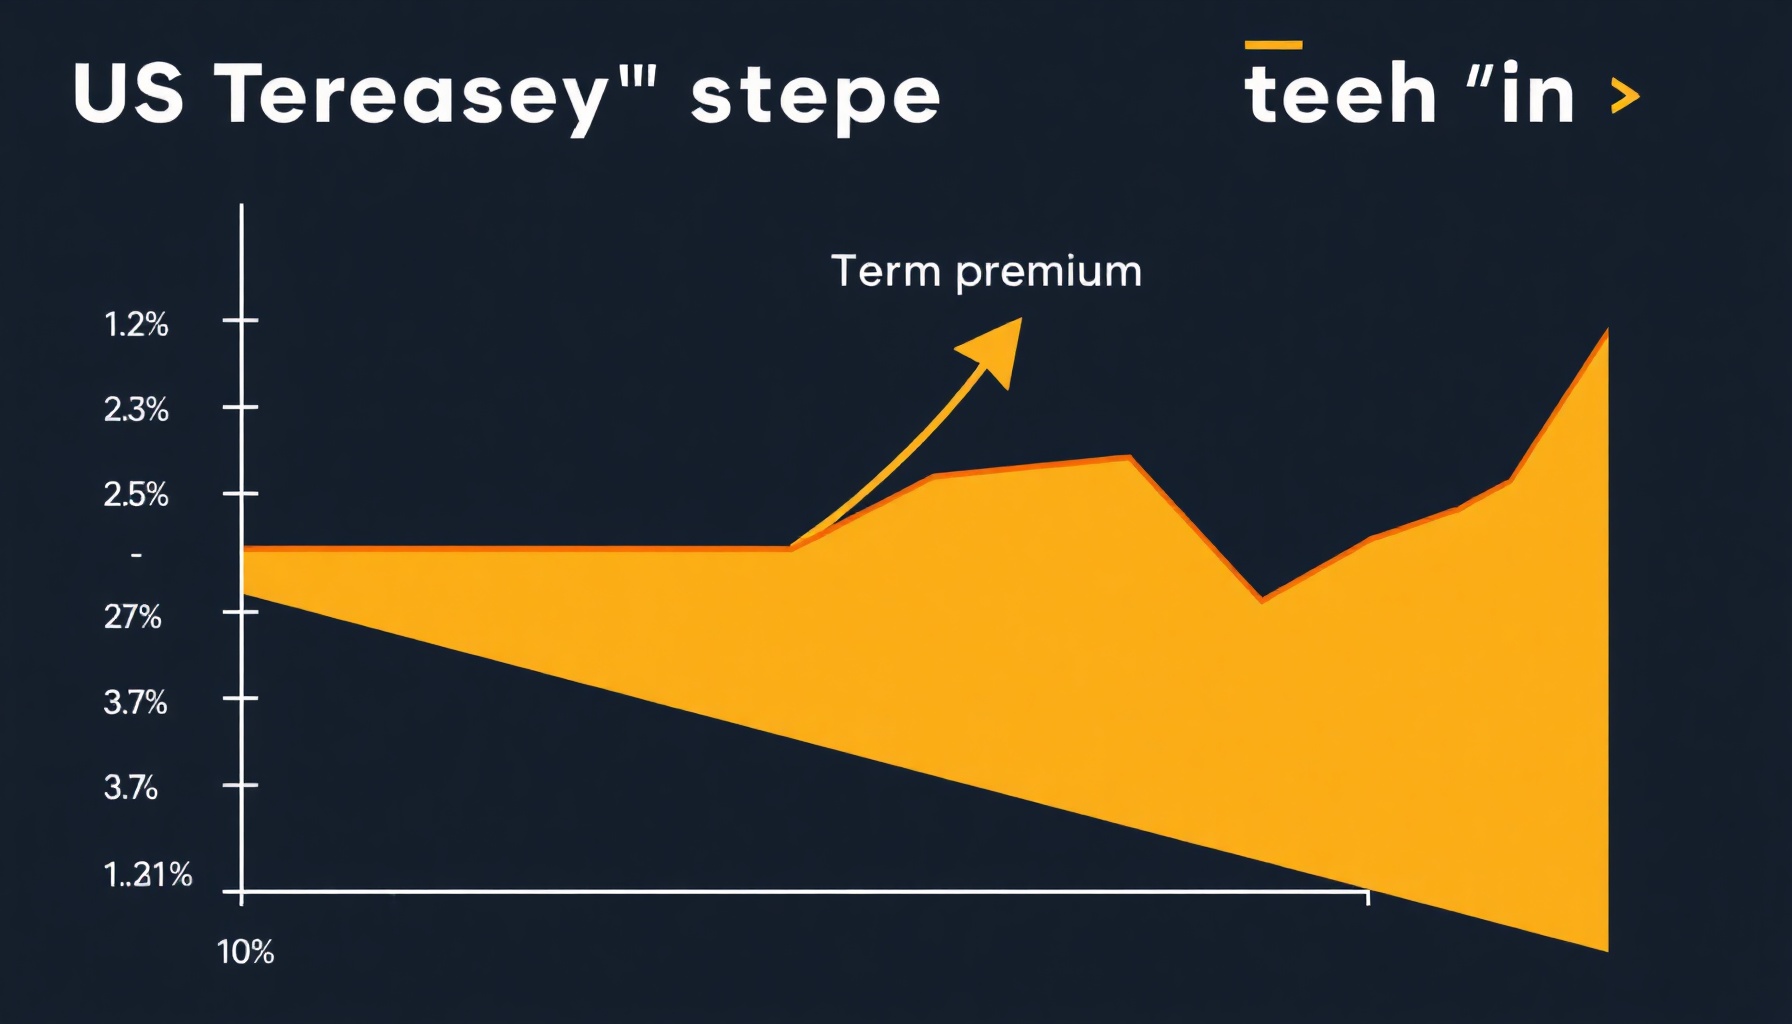
The Treasury term premium is the extra compensation investors demand for holding long-duration bonds instead of rolling short-term bills, over and above expected future short rates. The SF Fed’s model puts the 10-year term premium at 1.31% as of August 13, 2026, up from 1.23% a year earlier. Intuitively, a Treasury yield can be decomposed into two parts: the expected path of short-term policy rates over the bond’s life, and the term premium. For quant books, the premium is the separate, tradeable risk factor. It represents compensation for risks like future inflation volatility, supply/demand imbalances, and fiscal sustainability—risks that persist even if the Fed’s policy path is clear. Modeling it separately allows for more precise hedging and curve positioning.
Why long yields stay high: term premium, not Fed policy
Long yields stay high because the term premium, not expected Fed policy, is doing the heavy lifting: the 10-year term premium sits at 1.31% while the 2-year premium is just 0.23%, per the SF Fed Treasury Yield Premiums. The August 13, 2026 30-year auction cleared at about 5.216%, the highest since 2001, per The Guardian.
The evidence points away from an imminent Fed move driving the long end. The Fed has been on hold at 3.50–3.75% since July 29, a decision made on a 9–3 vote with dissents from Hammack, Kashkari, and Logan preferring a 25bp hike (FOMC statement). Market-implied odds for September 16 per CME FedWatch show 0.0% chance of a cut, 66.9% for no change, and 33.1% for a hike—a pricing that underscores a hawkish hold, not an easing cycle. Yet long yields are elevated.
The drivers are fiscal and inflationary. US debt is approaching $40 trillion (FiscalData), and ING THINK argues that renewed fiscal deficit deterioration is the bigger rates story than CPI. Sticky inflation persists: July CPI was +3.4% YoY headline and +2.5% core (BLS), while the 30-year yield sits near 5.24%, its highest since July 2007.
Crucially, the demand-side signal has not changed the premium story. July retail sales fell −0.6% MoM—the first decline in nine months and the largest drop in more than a year (Census/Bloomberg). This soft growth data has not dragged long yields down, reinforcing that the premium is driven by supply/duration risk, not growth optimism. This analysis contrasts with our look at the macro-economy-trends-august-2026 and weekly-market-pulse-2026-08-02, which focused on growth and policy paths.
What do the term premium models say?
The two standard models agree the premium has risen. The San Francisco Fed puts the 10-year term premium at 1.31% as of August 13, 2026, versus 1.23% a year ago, while the NY Fed’s Adrian-Crump-Moench model publishes official 1–10 year estimates back to 1961.
The SF Fed data shows a clear widening at the long end. The 2-year term premium is just 0.23% (up from 0.15% a year ago), compared to the 10-year’s 1.31%. This spread underscores where the risk compensation is concentrated. The observed yields on August 13 were 4.72% for the 10-year and 4.08% for the 2-year, with a slight move to 4.68% and 4.17% respectively by August 14 (Advisor Perspectives, US Treasury).
While the SF Fed and NY Fed models differ in methodology, they converge on the direction and magnitude of the premium increase. This corroborates the thesis that duration risk is being repriced. The SF Fed estimates were updated on August 14, 2026. For context, this aligns with our macro-divergence-august-2026 analysis, which noted widening valuation gaps. You can explore more of our research on yield curve dynamics.
Here is a small, illustrative Python snippet to fetch and visualize the 10-year term premium from official data. This is for data retrieval only; no backtesting is performed.
import pandas as pd
import matplotlib.pyplot as plt

# SF Fed publishes downloadable term-premium estimates on its Treasury Yield
# Premiums page (CSV/Excel links at the bottom). The exact URL and column
# names change over time, so confirm them on the page before running:
# https://www.frbsf.org/research-and-insights/data-and-indicators/treasury-yield-premiums/
url = "https://www.frbsf.org/wp-content/uploads/FRBSF_Term_Model_Data.xlsx"
df = pd.read_excel(url)

# Typical columns: date, plus term-premium estimates by maturity (e.g. "10Y")
tp10 = df[df["maturity"] == "10Y"]["term_premium"]

# Latest value and 1-year change
print(f"Latest 10Y term premium: {tp10.iloc[-1]:.2%}")

# Plot
tp10.plot(title="10-Year Treasury Term Premium (SF Fed)")
plt.ylabel("Percent")
plt.grid(True)
plt.show()
What should quant duration strategies do about it?
For quant fixed-income books, the signal is to treat duration risk as priced by the premium, not by rate-cut hopes: with the Fed on hold at 3.50–3.75% and September pricing 66.9% no-change per CME FedWatch, carry and curve strategies must account for a 1.31% term premium that can compress or expand without a single Fed move.
Actionable implications include:
- Monitor the premium as a standalone risk factor: Track official SF Fed updates (released regularly), NY Fed downloads, and auction results (like the 30-year’s ~5.216% yield) as realized-price signals for premium shifts.
- Hedge duration exposure when the premium is elevated and rising: The premium can mean-revert independently of the policy path. Its current elevated level suggests caution on outright long-duration positions.
- Stress-test curve/carry books against premium expansion scenarios: Model a +50bp premium move independently of rate-path shifts. This stress test is more relevant than a simple parallel yield curve shift.
- Treat auction tail risk as a supply/liquidity channel for premium: The 30-year auction result (Guardian, Gokhshtein) is a concrete data point for this channel.
- Label market-implied probabilities correctly: The September FOMC odds are market-implied, not a forecast.
This risk-factor management framework complements our earlier post on the fed-sept2026-fomc-hike-vs-hold decision and is relevant for our macro-economic-outlook-june-2026. For a broader look at sectoral implications, see our sectors analysis.
FAQ
The FAQ below answers the three questions quant traders most often ask about the term premium: whether Fed cuts would actually lower long yields, where to download the model estimates, and why the August 30-year auction cleared at its highest yield since 2001.
Would a Fed cut actually push long yields down?
Not necessarily. The term premium is compensation for duration and inflation risk, separate from expected policy rates: the Fed held at 3.50–3.75% on July 29 per the FOMC statement, yet the 10-year term premium still sits at 1.31%. A cut could even steepen the curve if investors demand more compensation for long bonds while deficits widen.
Where can I pull term premium data for my own models?
The SF Fed Treasury Yield Premiums page, updated August 14, 2026, and the NY Fed term premia tables both publish downloadable estimates: the NY Fed’s Adrian-Crump-Moench series covers 1–10 year maturities back to 1961. A small pandas snippet can fetch and plot the 10-year premium for your own models.
Why did the 30-year auction clear at its highest yield since 2001?
The August 13, 2026 30-year auction sold $25 billion at about a 5.216% high yield, the highest since 2001, pushing the 30-year yield near 5.24%, the highest since July 2007, per The Guardian. Investors demanded heavy premium on long-duration debt amid inflation persistence and US debt approaching $40 trillion.
← Back to all posts