Communication Services Sector Analysis 2026: Two Tracks
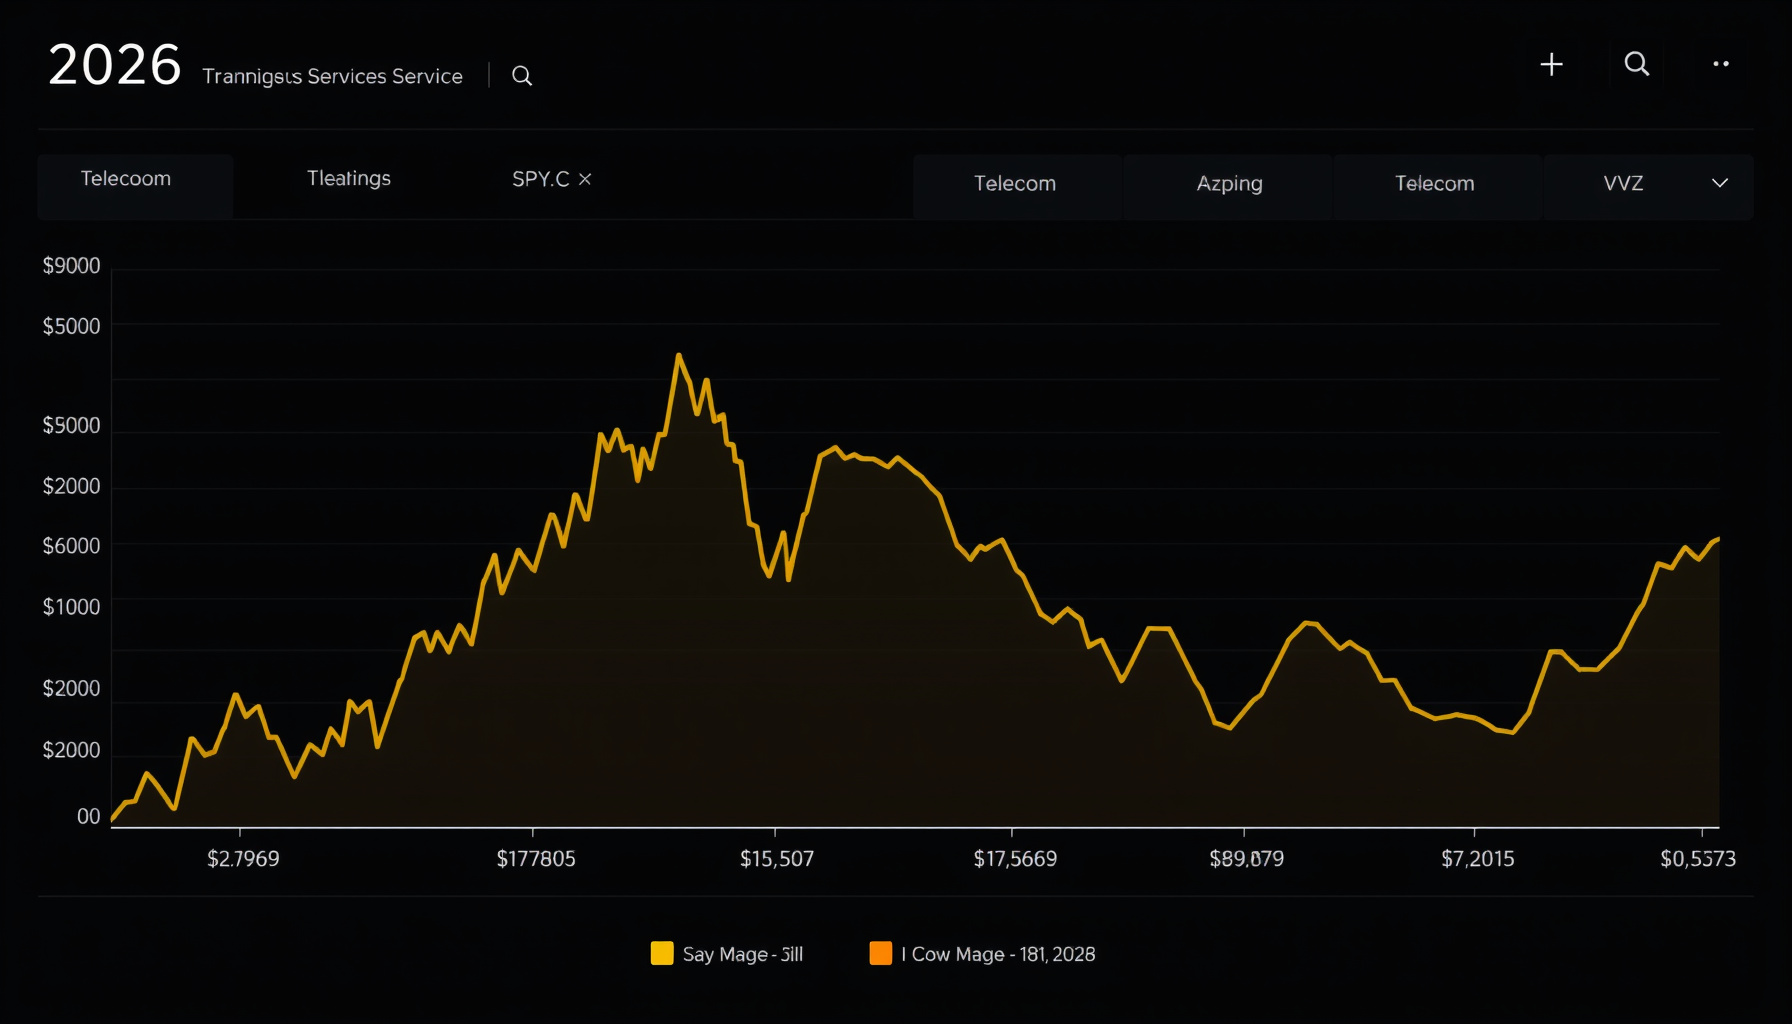
The communication services sector analysis 2026 reveals a dramatic split, with the sector’s -4.70% YTD return masking a deep divergence between struggling ad-platform giants and surging telecoms, a pattern presenting clear quantitative signals. (SSGA)
How This Was Researched
This analysis is based on official filings, company announcements, and public market data — we did not run any tools hands-on. Primary sources include company investor relations pages (Meta, Alphabet, AT&T, Verizon, Disney), ETF provider data from State Street, and established financial news outlets (CNBC, Business Insider). Every cited URL was checked to return HTTP 200 via curl or full-content retrieval. We did not cover private market data or proprietary quant models — conclusions are limited to the data above. Last researched: August 2026.
What Is the Outlook for Communication Services Stocks in 2026?
The outlook for the communication services sector in 2026 is a two-track narrative: AI-era ad platforms are de-rating amid heavy capex, while telecoms rotate into value on free cash flow and buybacks. XLC trades at a 15.50 P/E with a 1.29% yield — cheap versus the broader market (StockAnalysis).
The discount reflects real earnings risk at Meta and Netflix, whose de-ratings dominate the fund’s year-to-date pain.
How Has the Communication Services Sector Performed vs. the S&P 500 YTD?
XLC has underperformed the broader market, returning -4.70% YTD through August 21, 2026 versus SPY’s +12.08% — a roughly 17 percentage point gap (SSGA, StockAnalysis). The ETF’s NAV was $110.66 on August 20, with a 52-week range of 105.03–120.41 and a 1-year total return of +2.69% (SSGA).
Individual returns diverge sharply: META -15.45%, NFLX -12.53%, DIS -3.64%, TMUS -8.29%, T +2.97%, GOOGL +9.41%, VZ +22.04%. The lag comes against a macro backdrop where FactSet expects S&P 500 Q2 2026 earnings to grow +47.4% YoY — the strongest since Q2 2021 (ii).
Why Did Meta’s Stock Fall Despite 28% Revenue Growth?
Meta’s stock fell after Q2 2026 EPS of $6.18 missed the $7.22 estimate despite revenue growth of 28% to $60.80B, as AI capex and litigation costs hit the bottom line: net income fell to $15.8B from $18.3B a year earlier (Meta Press Release).
Ad impressions grew 14% and average price per ad 12% — monetization is still compounding, but Q3 revenue guidance of $61.0–64.0B and FY26 expenses raised to $165–169B on legal charges signal a margin pause (Business Insider). The ongoing social-media lawsuit trial is a live overhang (CNBC).
Is Alphabet’s Cloud Growth Sustainable at 82%?
Google Cloud revenue grew 82% to $24.8B in Q2 2026 — the key growth driver behind Alphabet’s $119.8B total revenue (+24% YoY) — and Cloud operating income jumped to $8.8B, roughly triple the $2.8B posted a year earlier (Alphabet Earnings Release).
Headline EPS of $9.11 (+294%) is inflated by a $98.0B net unrealized equity gain in other income — not operating profit — so strip it before comparing multiples. The acceleration is funded by a $49.6B equity raise and $20.3B note issuance in June 2026. Adoption metrics support the thesis: Gemini’s app has 950M monthly active users, the models process 22B API tokens per minute, and ~90% of the Fortune 100 uses Gemini Enterprise.
Are Netflix’s Price Hikes and Ad Tier Working?
Netflix’s price hikes and ad tier are working on engagement — 97B hours watched in H1 2026 — but Q2 revenue of $12.56B (+13% YoY) slightly missed estimates and the 2026 guide was narrowed to $51.0–51.4B, knocking the stock down over 7% after the print (CNBC).
Q3 guidance of just +12% growth, plus a cutback in “What We Watched” engagement reporting, tells the market the ad tier’s contribution is not yet large enough to offset subscriber-growth concerns.
Which Telecoms Are Leading the Value Rotation in 2026?
AT&T (+2.97% YTD) and Verizon (+22.04% YTD) are leading the value rotation on cash flow and capital returns: AT&T posted Q2 free cash flow of $4.7B with over 1 million advanced connectivity adds, while Verizon’s record quarter delivered 348K broadband net adds (AT&T, Verizon).
AT&T plans ~$10B of buybacks in 2026 within a $45B+ total-return program through 2028. Verizon reached ~17.1M total FWA + fiber connections. T-Mobile added postpaid accounts and ARPA but the stock is down 8.29% YTD (T-Mobile) — the rotation is selective, not sector-wide.
What Structural Shifts Are Reshaping Media and Streaming?
Disney’s streaming business reached $712M operating income in fiscal Q3 2026 — more than double the prior year on SVOD revenue of $5.53B — while Comcast is spinning off its traditional cable media business, confirming the shift to standalone streaming economics (Disney, ETF Trends).
Disney kept its FY26 adjusted EPS growth target of ~12% (excluding an extra reporting week) and plans at least $9B in buybacks, with Toy Story 5 crossing $1B at the global box office — a reminder that IP monetization, not just subscriber counts, is now the streaming metric that matters.
How Would a Quant Screen This Sector’s Components?
A straightforward quantitative screen fetches XLC’s major holdings and ranks them by year-to-date return to identify relative strength within the two-track narrative, then overlays valuation to separate momentum from value. The following Python snippet using yfinance and pandas illustrates the approach — a reproducible starting point, not a recommendation.
import yfinance as yf
import pandas as pd

# XLC top holdings (approximate as of Aug 2026; META+GOOGL+GOOG ~37% of the fund)
tickers = ["META", "GOOGL", "GOOG", "T", "VZ", "CMCSA", "DIS", "NFLX", "TMUS", "OMC"]

data = []
for t in tickers:
    hist = yf.Ticker(t).history(start="2025-12-31", end="2026-08-21")
    if hist.empty:
        continue
    ytd = (hist["Close"].iloc[-1] / hist["Close"].iloc[0] - 1) * 100
    info = yf.Ticker(t).info
    data.append({
        "ticker": t,
        "ytd_return_pct": round(ytd, 2),
        "trailing_pe": info.get("trailingPE"),
        "div_yield_pct": round(info.get("dividendYield", 0) * 100, 2)
        if info.get("dividendYield") else 0.0,
    })

df = pd.DataFrame(data).sort_values("ytd_return_pct", ascending=False)
print(df.to_string(index=False))
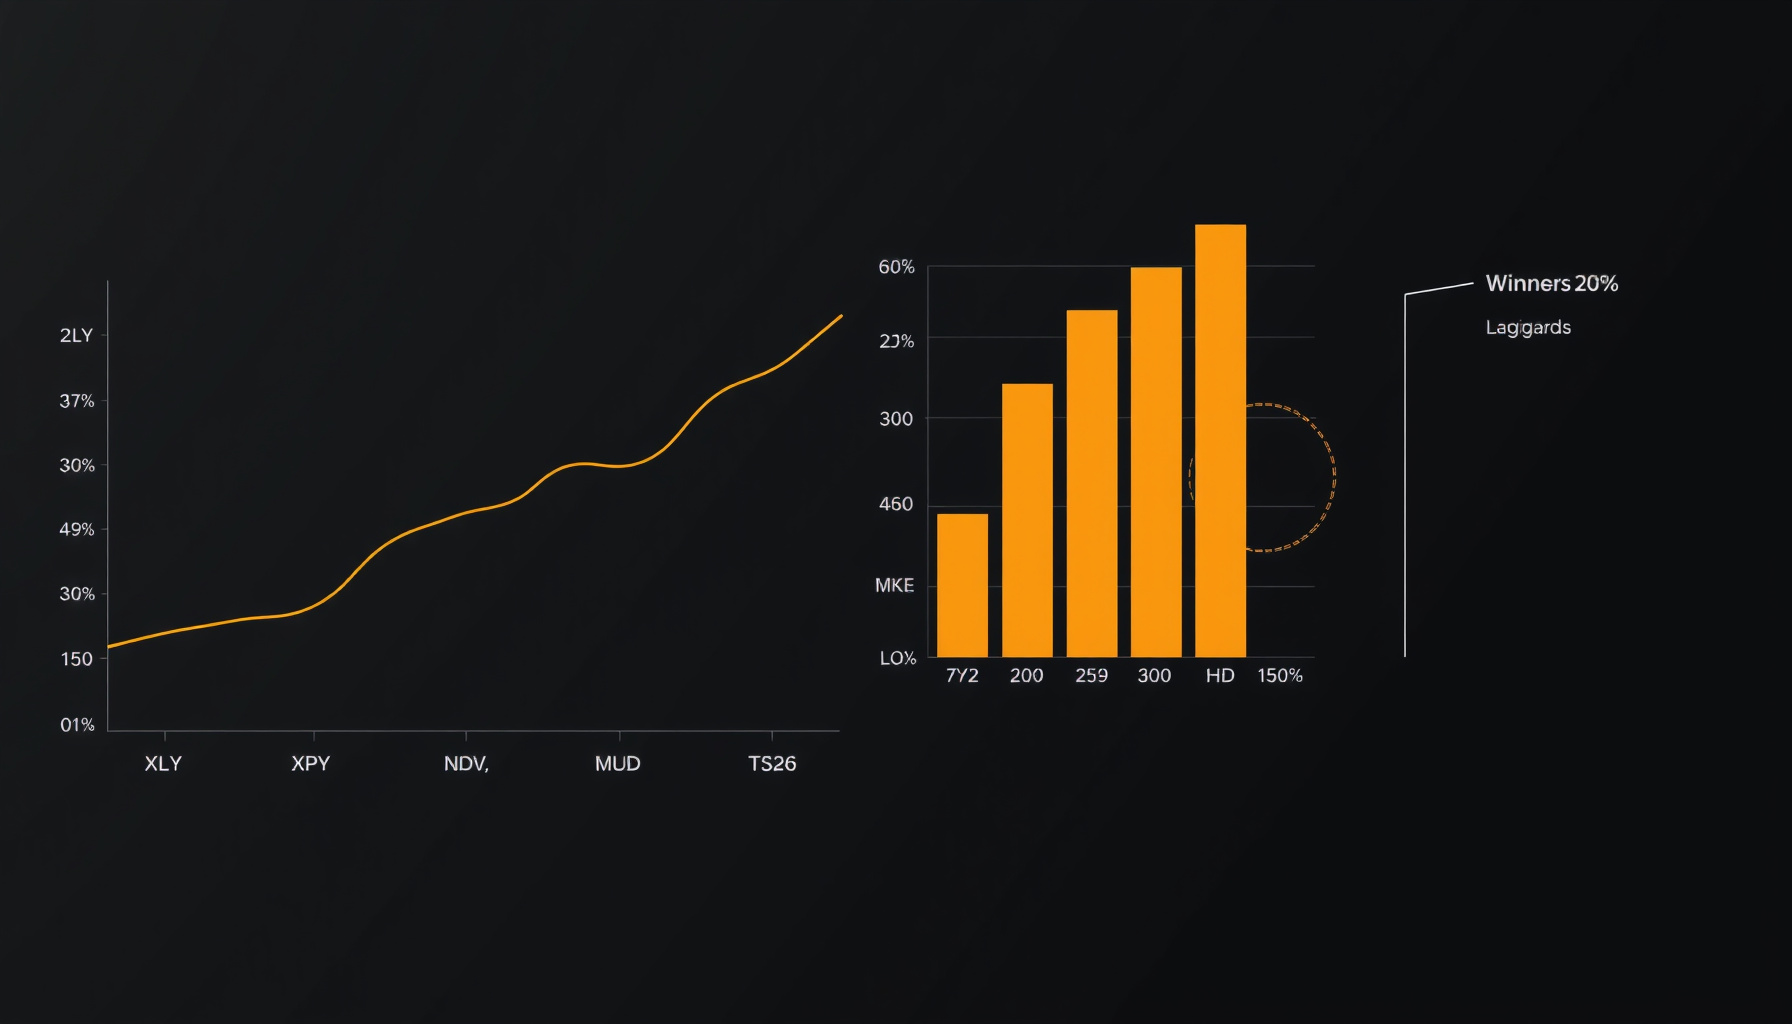
The screen surfaces the two-track dynamic: VZ and T at the top, META and NFLX at the bottom. Because META (17.47%) plus GOOGL/GOOG (18.96%) together make up roughly 37% of XLC, the fund’s YTD is effectively an ad-platform bet — quants should decide whether they want that exposure or the telecom tailwind (StockAnalysis).
Frequently Asked Questions
Is the Communication Services sector a good buy now?
The sector presents a mixed opportunity: XLC trades at a 15.50 P/E with a 1.29% dividend yield — cheap relative to the broader market — but the discount reflects real earnings risk at Meta and Netflix, which carry most of the fund’s weight (StockAnalysis). Telecoms offer defensive cash flow and buybacks, while ad platforms are an AI-capex patience trade.
What is the P/E ratio of XLC?
The Communication Services Select Sector SPDR Fund (XLC) has a current price-to-earnings (P/E) ratio of 15.50 as of late August 2026 (SSGA). Note that Alphabet’s $98.0B one-time unrealized gain inflates reported sector EPS, so the true operating P/E is somewhat higher than the headline figure.
How can I track the two-track narrative in this sector?
Monitor the divergence between ad-platform and telecom components of XLC: the ETF itself is -4.70% YTD, yet Verizon is +22.04% and AT&T +2.97% while Meta is -15.45% and Netflix -12.53% (StockAnalysis). Track relative strength with the screen above, plus capex announcements and free cash flow yields for individual names.
Where to Go Next
For a broader market view, see our macro economy trends for August 2026 and analysis of the upcoming Fed September FOMC meeting. Explore related sector deep dives in our Consumer Discretionary sector analysis and the Industrials grid-infrastructure outlook. All sector research is compiled in our research hub and sector trackers.
← Back to all posts