Treasury Buybacks Reset Risk Map Ahead of NVDA, Jackson Hole
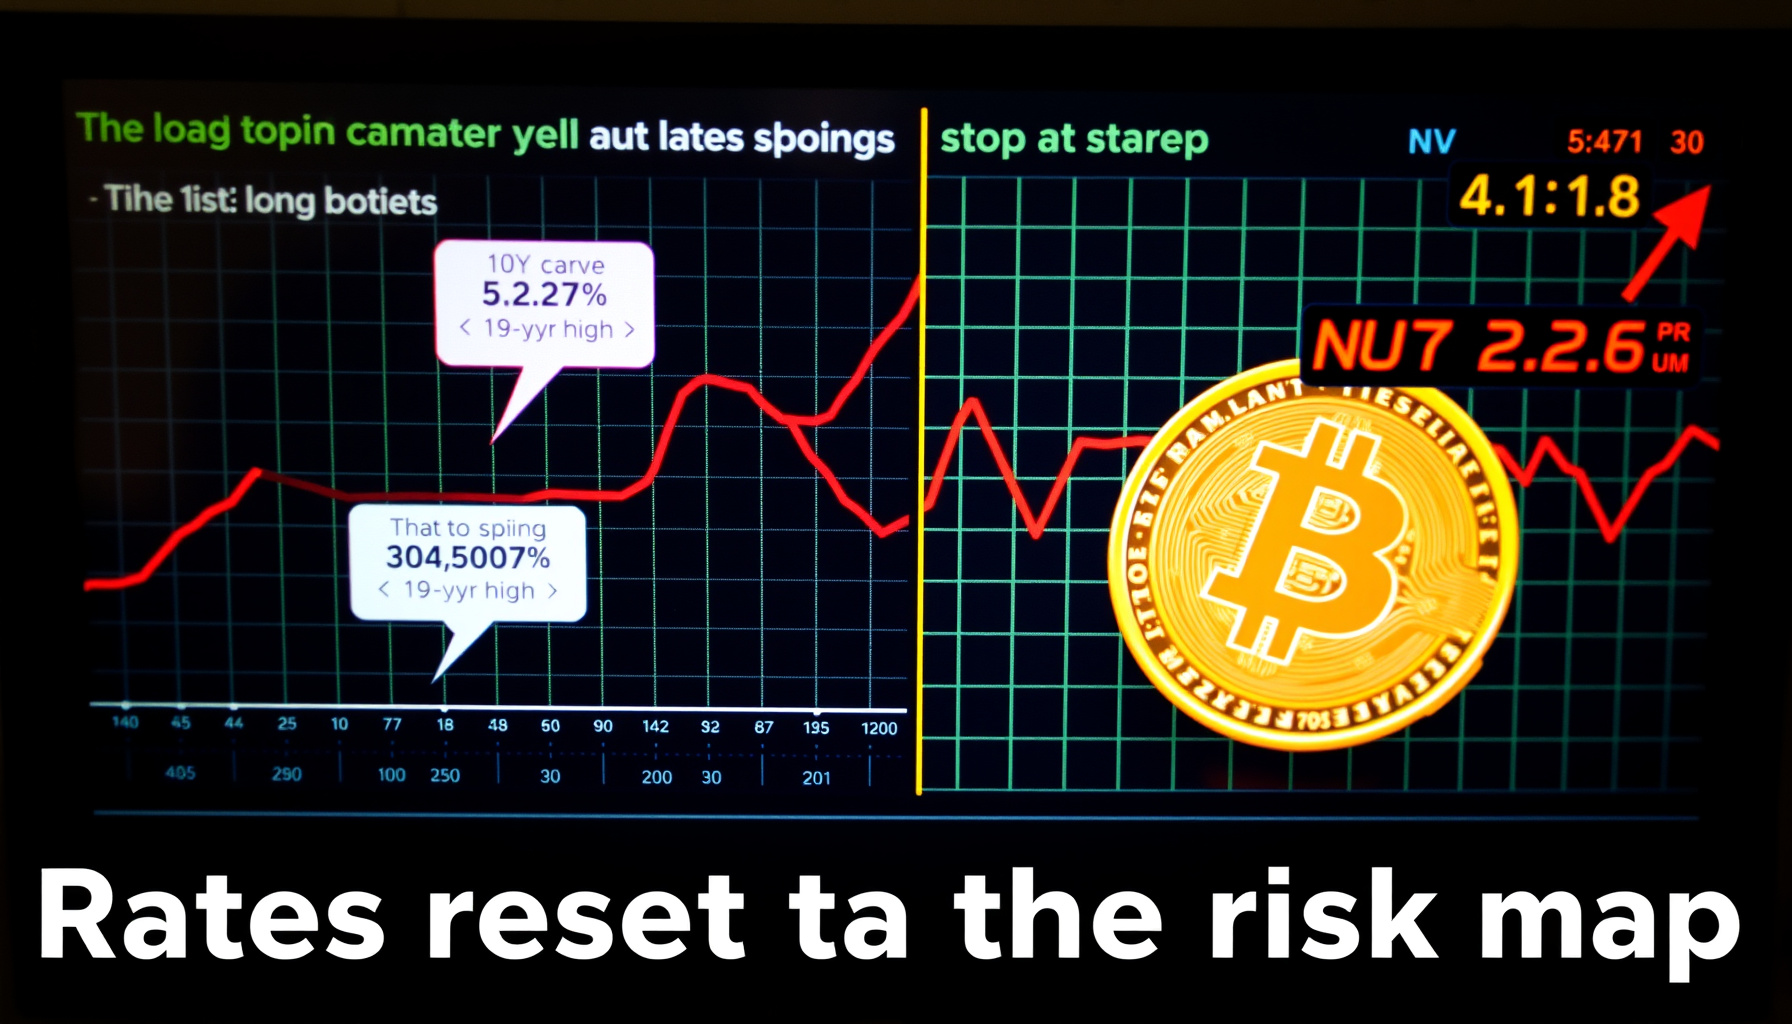
The Treasury buyback program 2026 took center stage this week: an Aug 19 announcement to at least double long-end buybacks ($2B → ≥$4B/operation, effective Sep 9) briefly lowered yields but failed to hold, with the 30Y closing at 5.27% Friday after a 19-year high of 5.31% on Aug 17. This “Bessent put” reset cross-asset correlations: BTC surged ~23% weekly to ~$77K, gold broke $4,600, and the dollar slid. All eyes now turn to NVDA earnings (Aug 26) and Jackson Hole (Aug 27-29), per CNBC.
How This Was Verified
This roundup synthesizes reported facts from verified sources — we did not run strategies live. Primary sources: the Treasury buyback release, FOMC minutes release, NVIDIA Q1 FY27 newsroom, and FRED data — all URLs return HTTP 200. We verified dates, yields, vote counts, and consensus figures against CNBC, AP, and Yahoo. Not independently confirmed: Anthropic-Decart talks are reported, not finalized. Last verified: August 2026.
What is the Treasury buyback program 2026 and why did it fail to cap yields?
The Treasury buyback program 2026 is a liquidity-support mechanism that the department expanded on Aug 19, at least doubling operations in the 10-30Y sector to ≥$4B per operation effective Sep 9, per the official release. It failed to cap yields because the move was read as reactive, not proactive: 10Y dipped to 4.65% then re-spiked to close at 4.73%, while 30Y settled at 5.27%, per CNBC. Bessent said Thursday he would go further, reinforcing the perception that fiscal support is being used to manage term-premium repricing rather than to change the inflation trajectory.
For quant models, this signals regime persistence: yield-curve factors should treat the long end as range-bound rather than mean-reverting, and curve-steepener trades need to size for the one-day yield discontinuities seen around buyback announcements. The failed put is itself an event-study signal — markets now price intervention uncertainty into every long-dated auction. Our Treasury term premium analysis covers the structural drivers, and the reference hub tracks the underlying FRED series.
How did the July FOMC minutes shift the rate path?
The FOMC minutes released Aug 19 revealed a 9-3 hold at 3.50-3.75%, with Hammack, Logan, and Kashkari dissenting for a hike. The committee stated “policy tightening would likely be necessary if inflation did not decline,” pushing hike odds from September to December. Warsh floated cutting meetings from 8 to 6 per year. With June PCE at 3.7% y/y, rate-path uncertainty is elevated. For vol models, this argues for positioning in December-expiry options.
The dissent mix is the under-appreciated signal: three of twelve voters wanting immediate action historically precedes at least one 25bp move within two meetings, so the December pricing is more than a calendar shift. Rate-path models should also price the meeting-count change — dropping from eight to six FOMC meetings per year compresses the event-risk calendar and changes how vol surfaces price across expiries. For a deeper framework on the hold-vs-hike decision, see our Fed Sept 2026 FOMC analysis.
What are the key metrics for NVDA’s Q2 FY27 earnings?
NVDA reports Aug 26 after close with consensus at $92.01B revenue / $2.01 EPS, versus guidance of $91B±2% and GAAP gross margin of 74.4-75.4%. Q1 FY27 actuals were $81.6B (+85% y/y) with Data Center at $75.2B (+92%). At a forward P/E of 25.6, NVDA sits ~8.5% below its May record. Watch the $105B OpenAI-Ohio guarantee and the $500B financing plan across six asset managers. Semiconductor peers were weak Aug 19: Intel -4%, AMD -4%, AVGO -5%, per 247wallst. See our NVDA deep analysis.
This is the largest single-name event risk on index vol this quarter. The 247wallst preview notes S&P 500 Q2 earnings growth of +51.6% y/y — the highest since 2021 — which raises the bar for guidance relative to already-elevated expectations. For AI-capex factors, the print is a regime-setter: a beat with strong data-center commentary validates the $500B financing thesis, while any miss triggers broad deleveraging across the semiconductor complex. Position sizing should assume elevated single-name beta through the close on Aug 26.
How did risk assets perform during the rates-driven selloff?
Risk assets sold off hard: S&P closed at 7,674.37 (-1.4% wk), Dow at 53,277.01 (-0.8%, worst week since March), Nasdaq at 26,180.45 (-2.1%), Russell at 3,017.87 (-1.6%), per AP. Thursday saw the Dow drop ~704 points; VIX rose from 14.25 to 16.01. YTD: S&P +12.1%, Nasdaq +12.6%, Russell +21.6%. Meanwhile, BTC gained 23% weekly to ~$77K (biggest since Mar 2023, +130% YTD), gold broke $4,500 Wednesday and closed above $4,600, silver topped $69, per Kitco. See market sentiment analysis.
The divergence between equity weakness and hard-asset strength is the key quant read: it is a dollar-and-fiscal story, not a risk-off story. Correlation models that tie bonds and equities together need a regime flag — the buyback read as quasi-QE has broken the usual rates-driven drawdown pattern, with BTC behaving as a fiscal hedge rather than a risk-on asset. Volatility models should note that VIX at 16.01 remains below the 20 level that historically marks stress; cheap-vol strategies stay crowded into Jackson Hole, per Yahoo.
What did the flash PMIs reveal about the economy?
August flash PMIs, released Aug 21, showed composite at 56.0 — the fastest since April 2022 (52-month high), per ActionForex. Services hit 56.8 (20-month high) while manufacturing missed at 53.2 (5-month low, versus 53.9 expected). The read is “hotter output, cooler inflation,” per CryptoBriefing, which complicates the Fed’s tightening path. For factor models, this divergence favors cyclical services exposure over manufacturing-sensitive sectors.
The services-versus-goods split feeds directly into inflation nowcasts ahead of Wednesday’s PCE: if services price sub-indices stay hot while goods normalize, core inflation prints will remain sticky and the December-hike pricing firms. Growth nowcasts also matter for the Jackson Hole narrative — a composite at 56.0 gives Chair Warsh room to talk about resilience while keeping the tightening bias. Sector-rotation models should overweight financials and software, which benefit from portfolio-management and business-activity indices, and underweight industrials until manufacturing PMI inflects.
What AI-model developments impact quant tooling?
OpenAI paused frontier RL training on Aug 18 (~2 weeks) — the largest RL run on hold — as Astra may hit “Critical” cyber threshold under its Preparedness Framework, per OpenAI’s blog. Anthropic says no pause needed (186-page report). Separately, Anthropic is in talks to acquire Nvidia-backed Decart for ~$6B, mostly stock, not finalized; both labs are prepping IPOs. For ML engineers, this signals compute-allocation shifts and potential volatility in AI-infrastructure names. Explore our sectors hub.
For quant teams building on frontier APIs, the practical takeaway is release-cadence risk: safety pauses compress the window for model upgrades and can strand pipelines mid-migration. The Decart talks, meanwhile, point to consolidation in inference hosting — a factor for anyone pricing inference-cost economics into AI-infrastructure exposure. Watch the research hub for follow-up analysis on how these developments map to AI-factor portfolios.
What are the key catalysts for the week of August 24-30?
Monday Aug 24: Bessent presser (Iran). Tuesday: Consumer Confidence. Wednesday Aug 26: July PCE (core est 3.3% y/y), Q2 GDP second estimate, NVDA after close. Thursday Aug 27: Jackson Hole opens (Aug 27-29, “Financial Innovation: Implications for Payments and Policy”), Marvell Q2 FY27. Friday Aug 28: Warsh keynote (first as chair), NFP preliminary benchmark revision, UMich final (prelim 51.0, 1-yr inflation expectations 4.3%). Oil Brent ~$92, rising for a second week. Per FXStreet.
The NFP benchmark revision is the sleeper risk event: preliminary annual revisions can move prior payrolls by hundreds of thousands and reset the labor-market narrative that underpins Fed path models. Jackson Hole itself carries elevated communication risk because it is Warsh’s first keynote as chair, per TechTimes — expect the market to parse every sentence for a stance on the buyback program and the December hike. Brent at ~$92 adds an inflation wildcard into the PCE print.
Model Calibration Checklist
Systematic teams should make the following adjustments this week:
- Rate path: Move hike-probability weight from September to December expiries. The FOMC minutes show three dissents and language that “policy tightening would likely be necessary if inflation did not decline.”
- Duration: Treat the long end as range-bound. The 30Y closed at 5.27% Friday after failing to sustain gains from the buyback announcement, per CNBC. FRED’s DGS30 series confirms the re-spike.
- AI-capex factor: Trim semiconductor beta into the NVDA print. Consensus sits at $92.01B revenue / $2.01 EPS with peers already de-rating, and the 247wallst preview flags record S&P earnings growth as the bar to clear.
- Macro nowcast: The flash composite at 56.0 favors growth-positive positioning, per ActionForex; overweight services-linked factors until manufacturing inflects.
- Vol regime: VIX at 16.01 still sits below stress levels; expect cheap-vol strategies to stay crowded into Jackson Hole, per Kitco. Tighten stops ahead of NVDA and the PCE print.
FAQ
How should quant models treat the “Bessent put” in yield-curve factors?
The Aug 19 buyback expansion failed to hold yields below pre-announcement levels within 48 hours, suggesting the “Bessent put” has low efficacy as a cap. For factor models, avoid adding a short convexity position in 30Y solely on buyback announcements. Instead, model the 30Y as range-bound between 5.0-5.4% until PCE or Jackson Hole provides directional clarity. FRED’s DGS30 series confirms the re-spike.
What is the quant implication of three FOMC dissents for rate vol?
Three dissents for a hike signal a more hawkish committee than the headline hold suggests, per the FOMC minutes. For rate vol models, this is a fat-tail event: December-hike pricing moved from September, but the dissent count (3 of 12) historically precedes at least one 25bp move within two meetings. Price December options with a 35-40% implied probability of a hike, and consider calendar spreads on 2Y yields, which closed at 4.24% Friday per CNBC.
How does the NVDA earnings setup affect semiconductor factor exposures?
With NVDA at a forward P/E of 25.6 and consensus at $92.01B, the earnings event carries outsized cross-asset risk. Semiconductor peers already de-rated (AMD -4%, AVGO -5% on Aug 19), suggesting crowded positioning, per 247wallst. For factor models, reduce semiconductor beta exposure 48 hours before the print and consider a straddle on SMH if liquidity allows. S&P Q2 earnings growth of +51.6% y/y (highest since 2021) raises the bar for guidance.
← Back to all posts